Case Management Dashboard
On the Dashboard you can find:
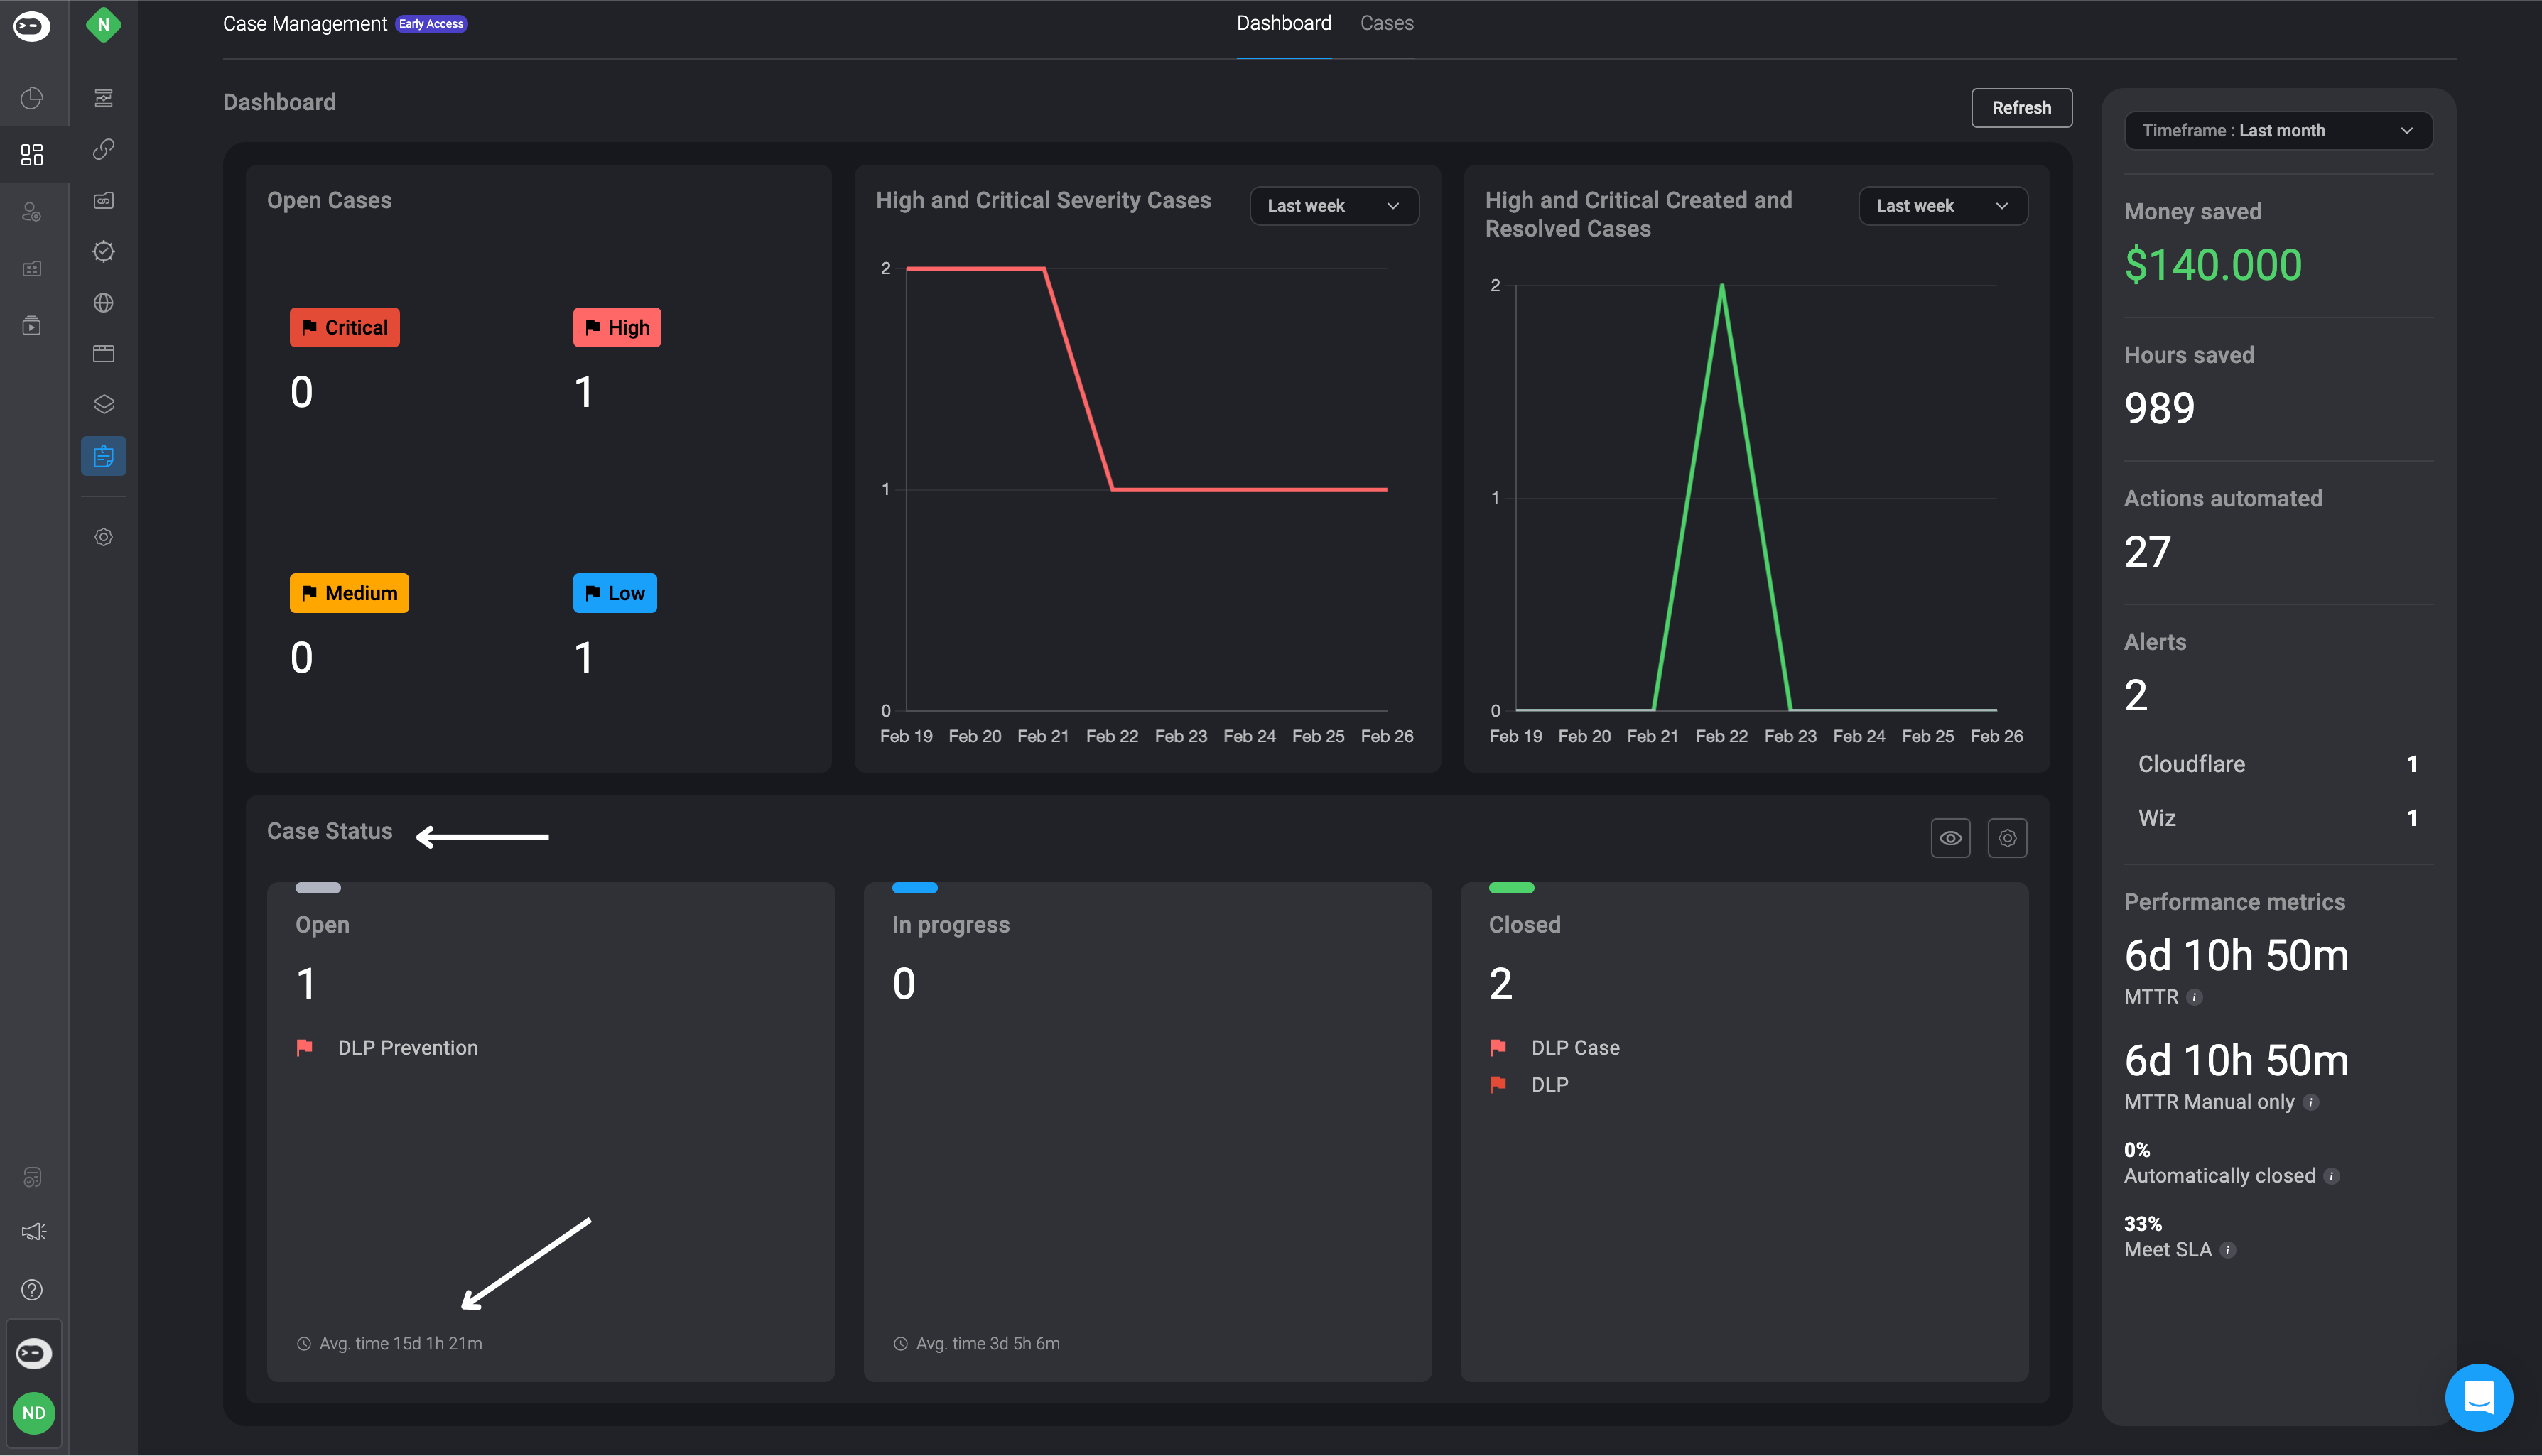
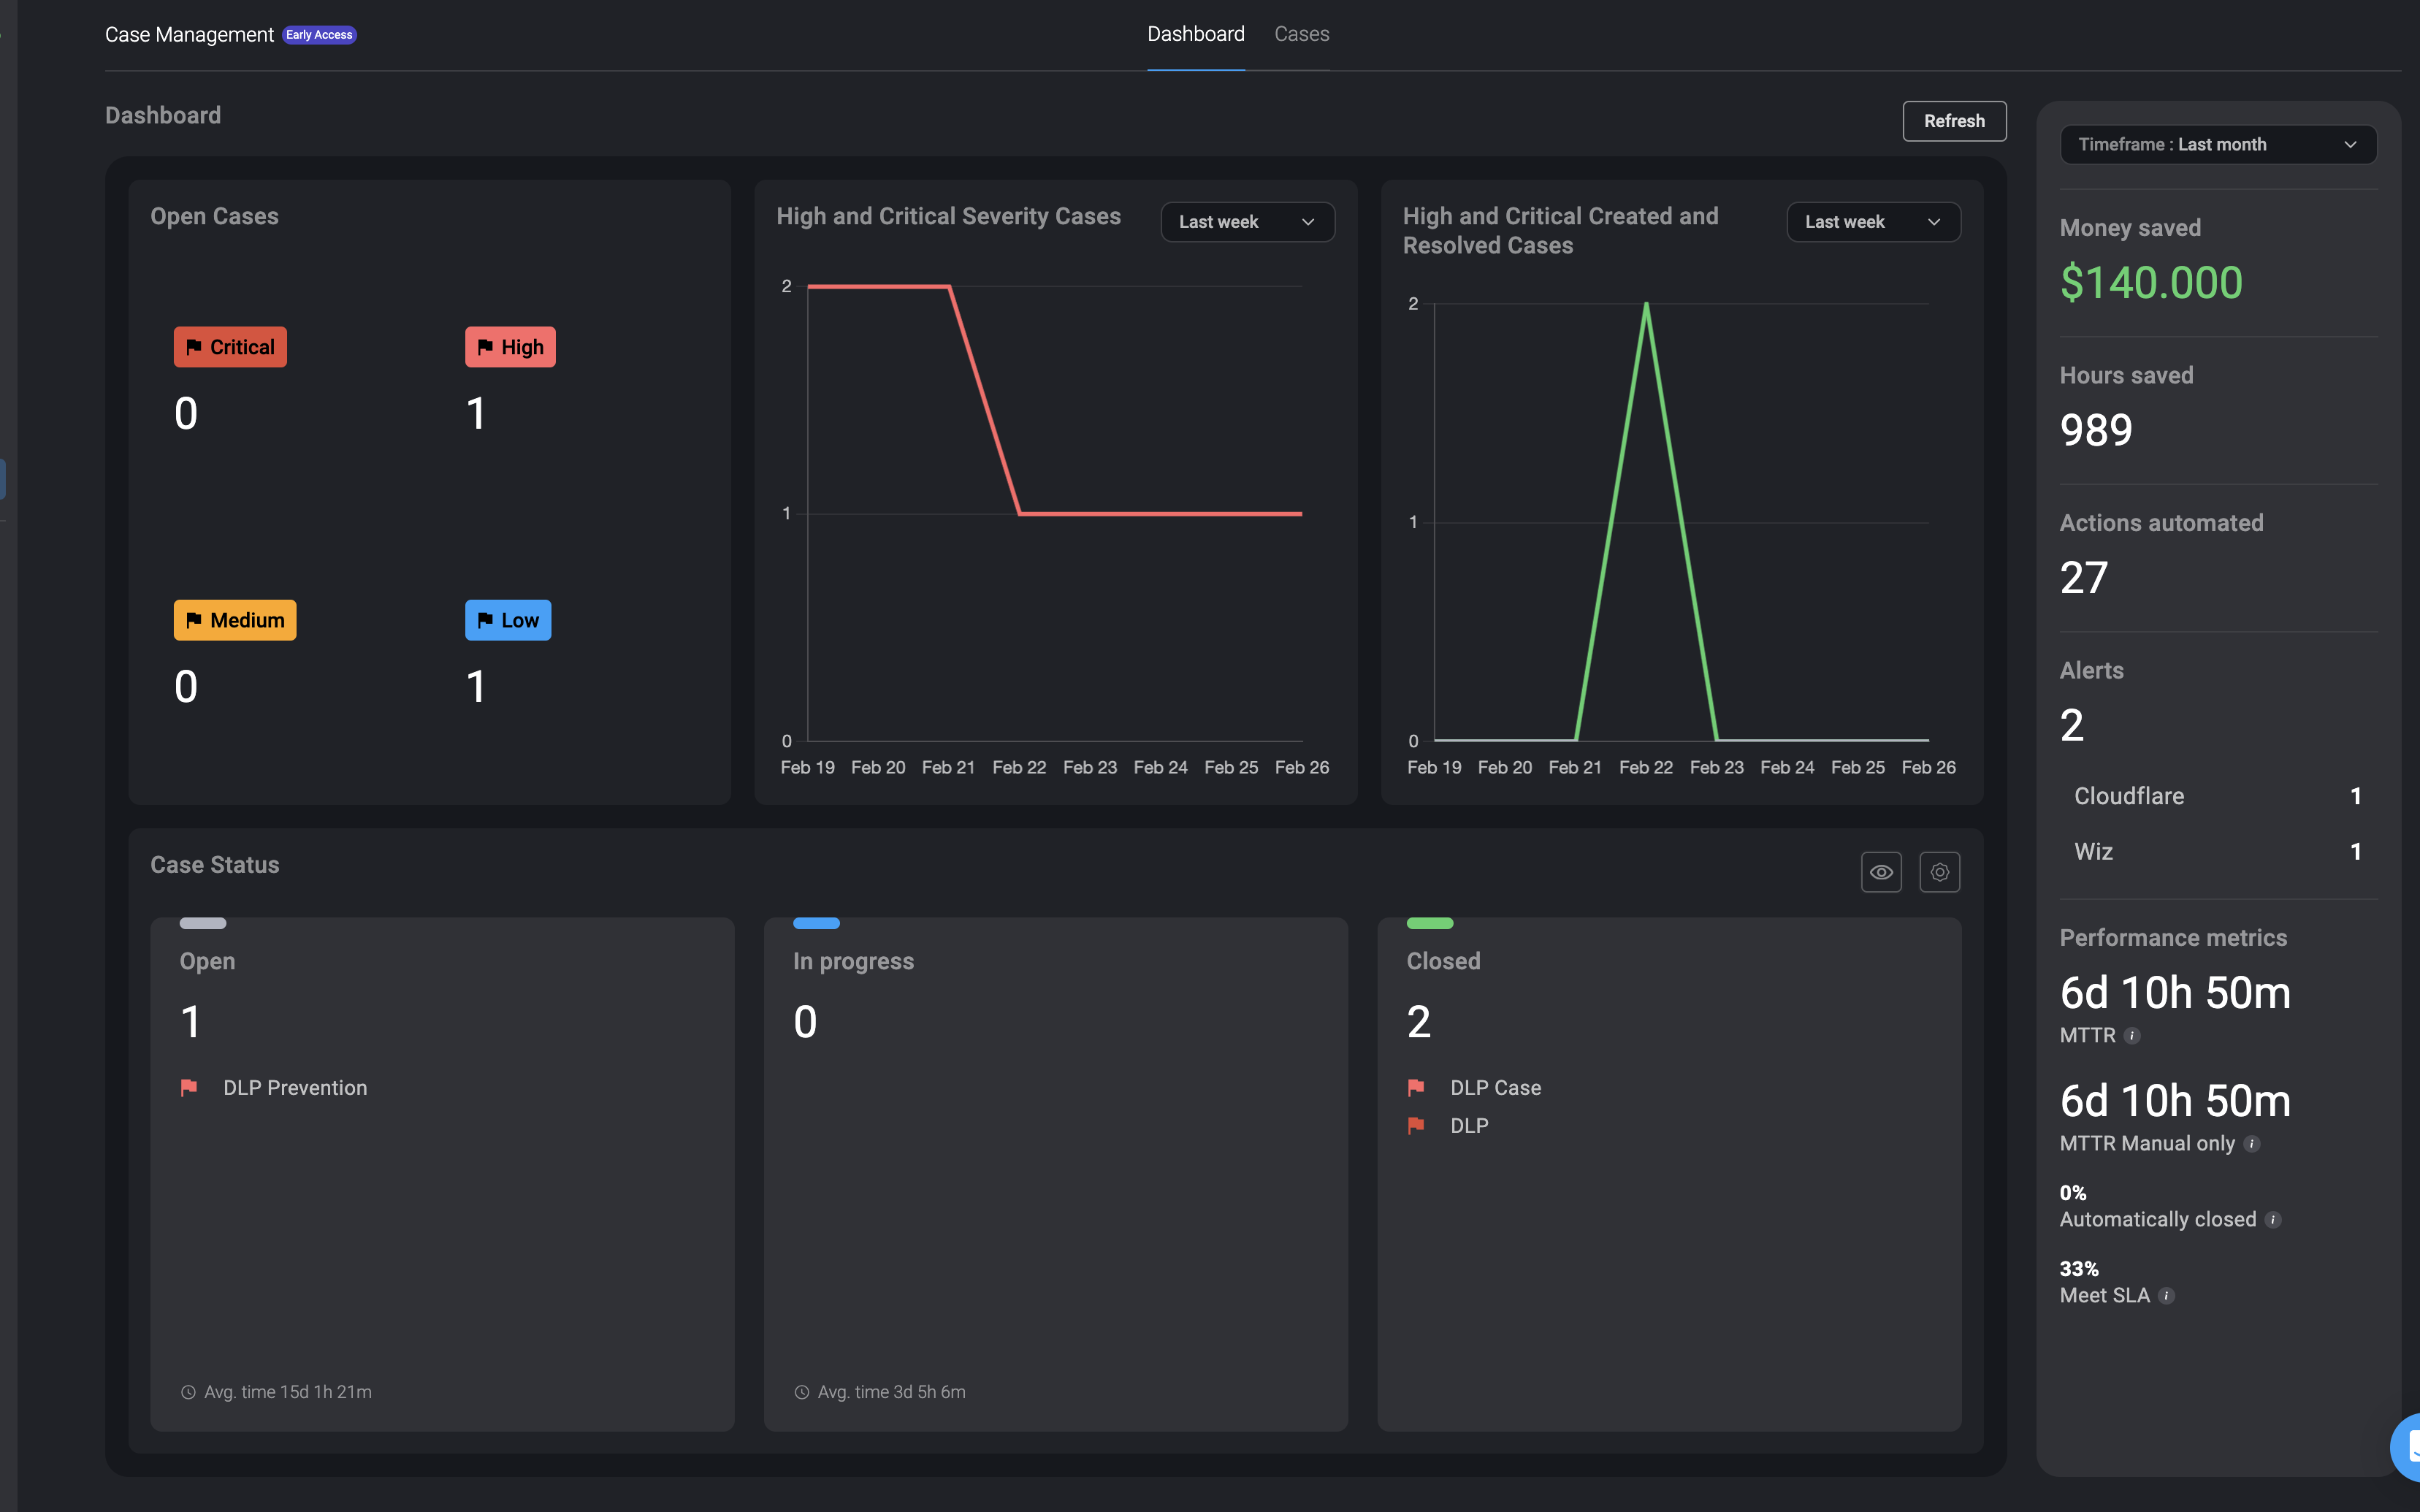
- Open cases which detail the amount of cases that are low, medium, high and critical.
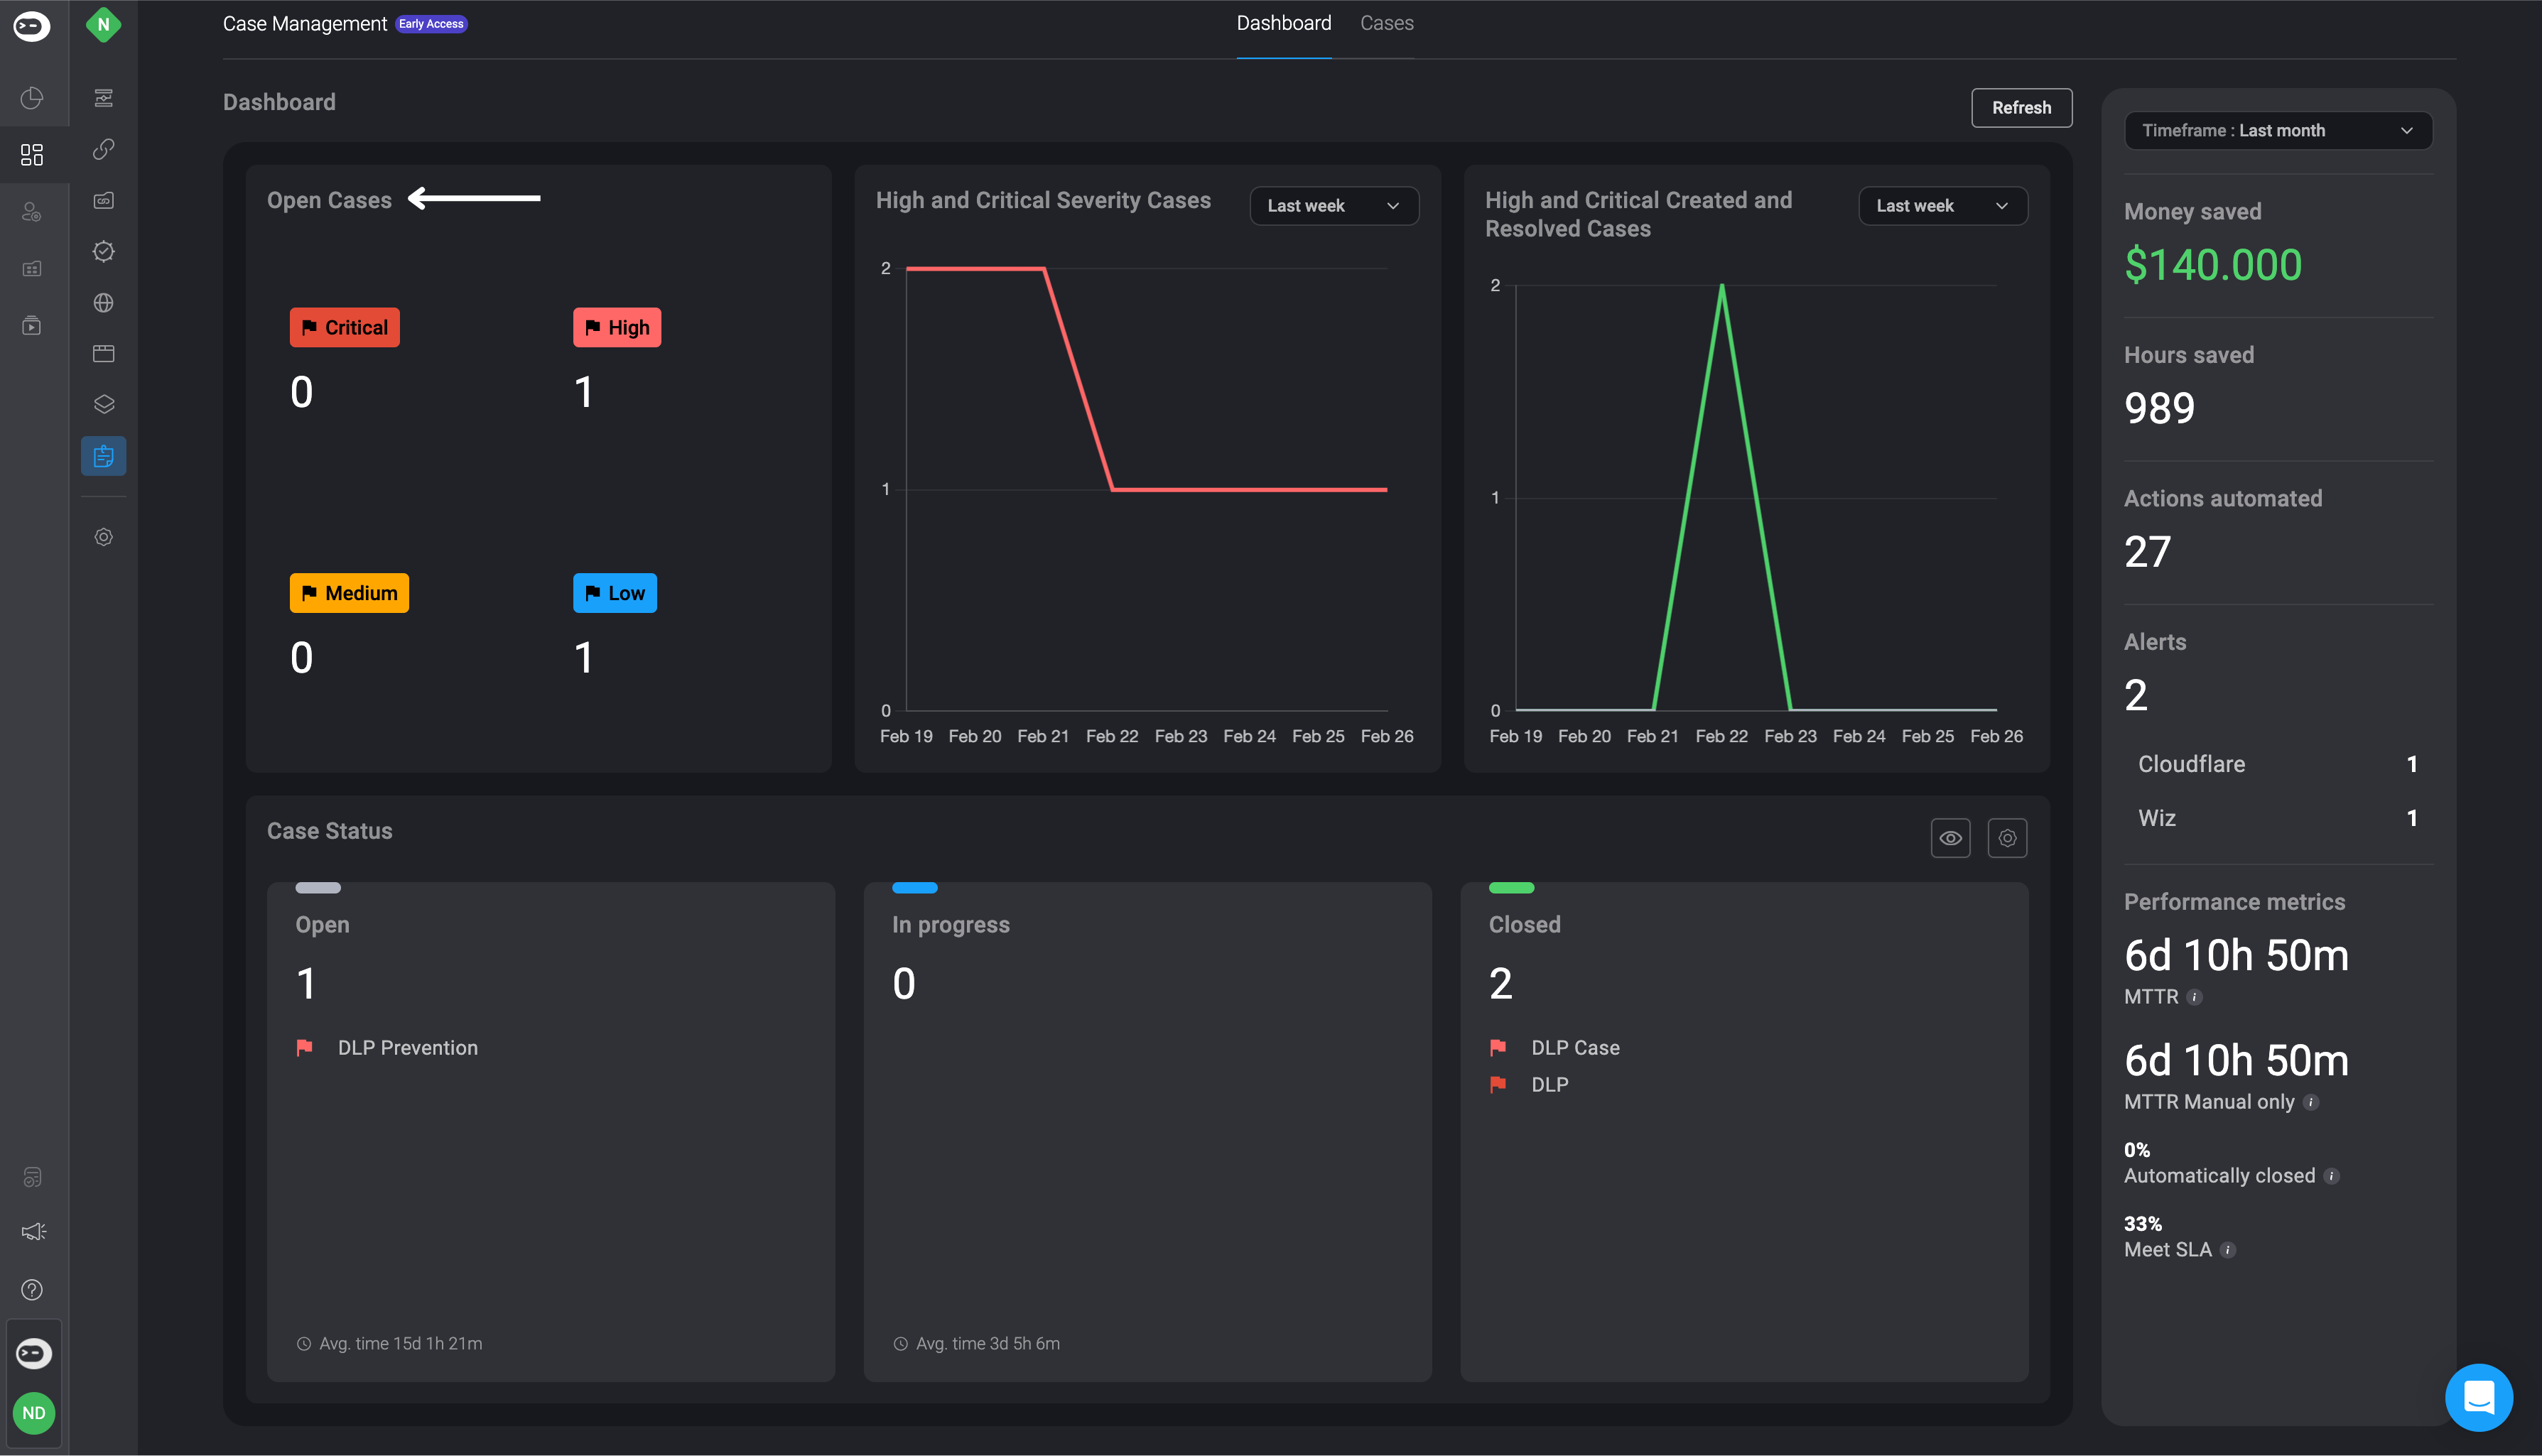
- A graph illustrating the amount of active high and critical severity cases within a specified time period. Easily customize the displayed cases based on your chosen timeframe using the dropdown menu.
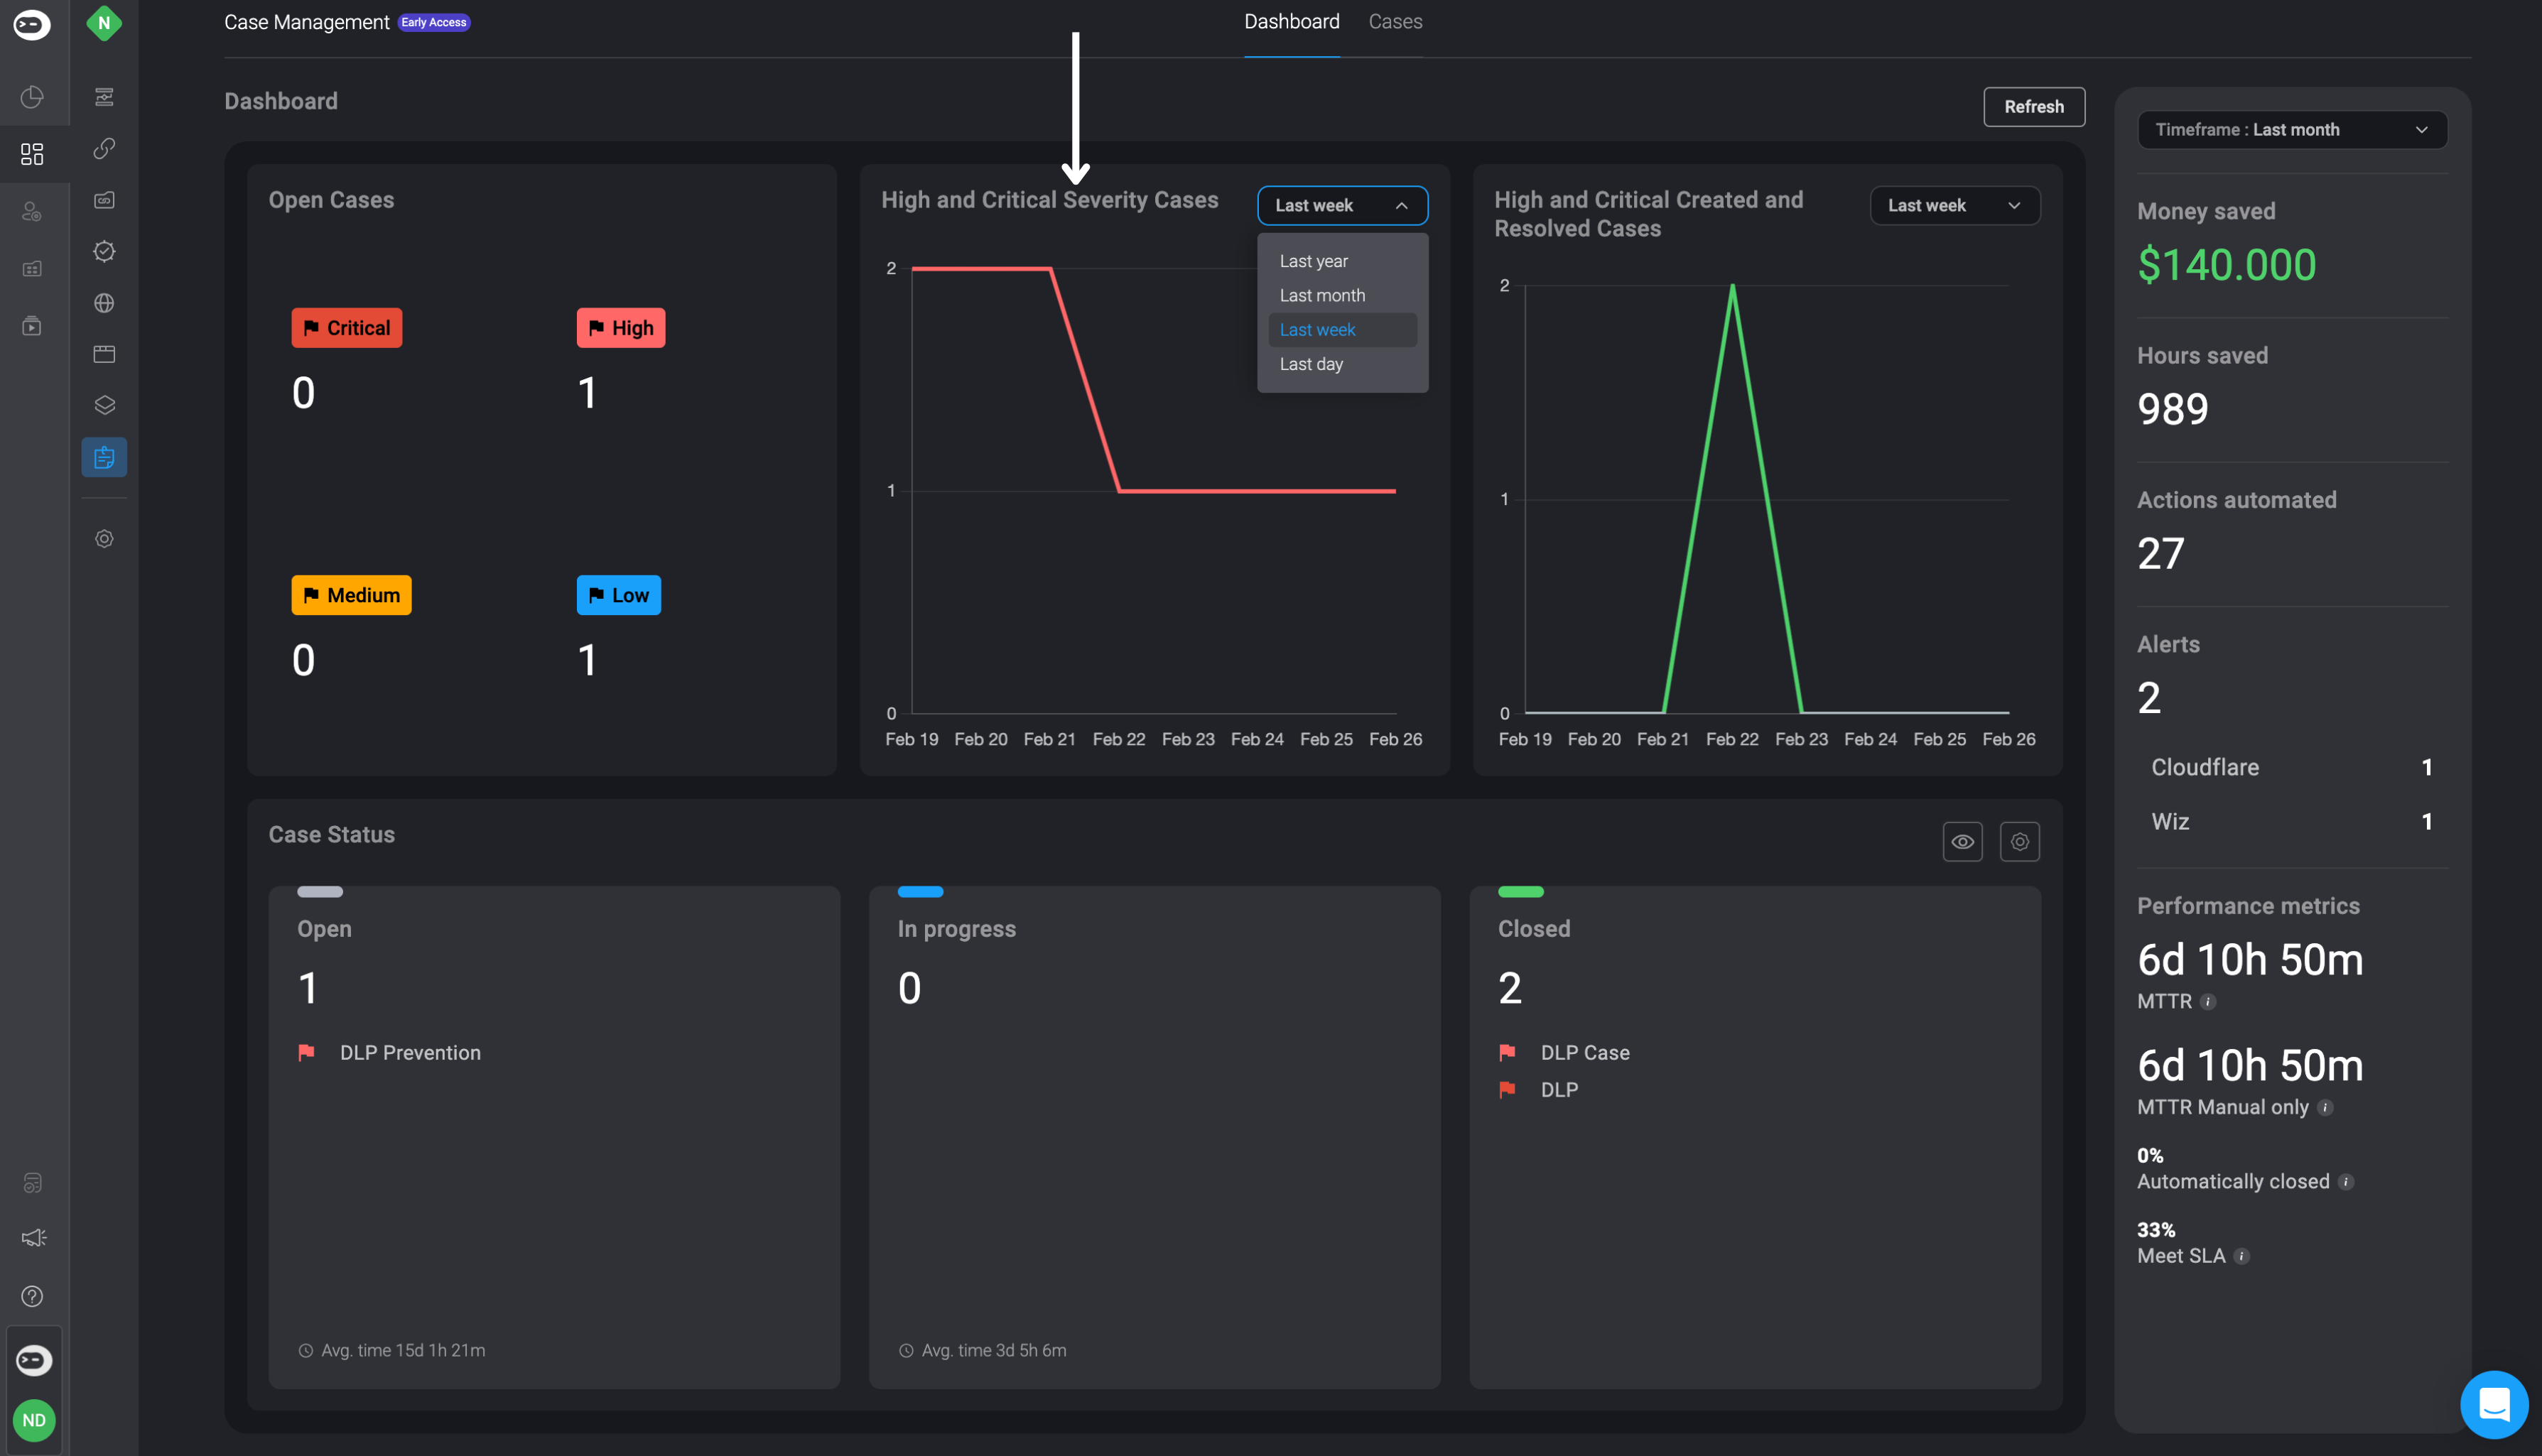
- A graph illustrating the amount of high and critical severity cases created and resolved within a specified time period. Easily customize the displayed cases based on your chosen timeframe using the dropdown menu.
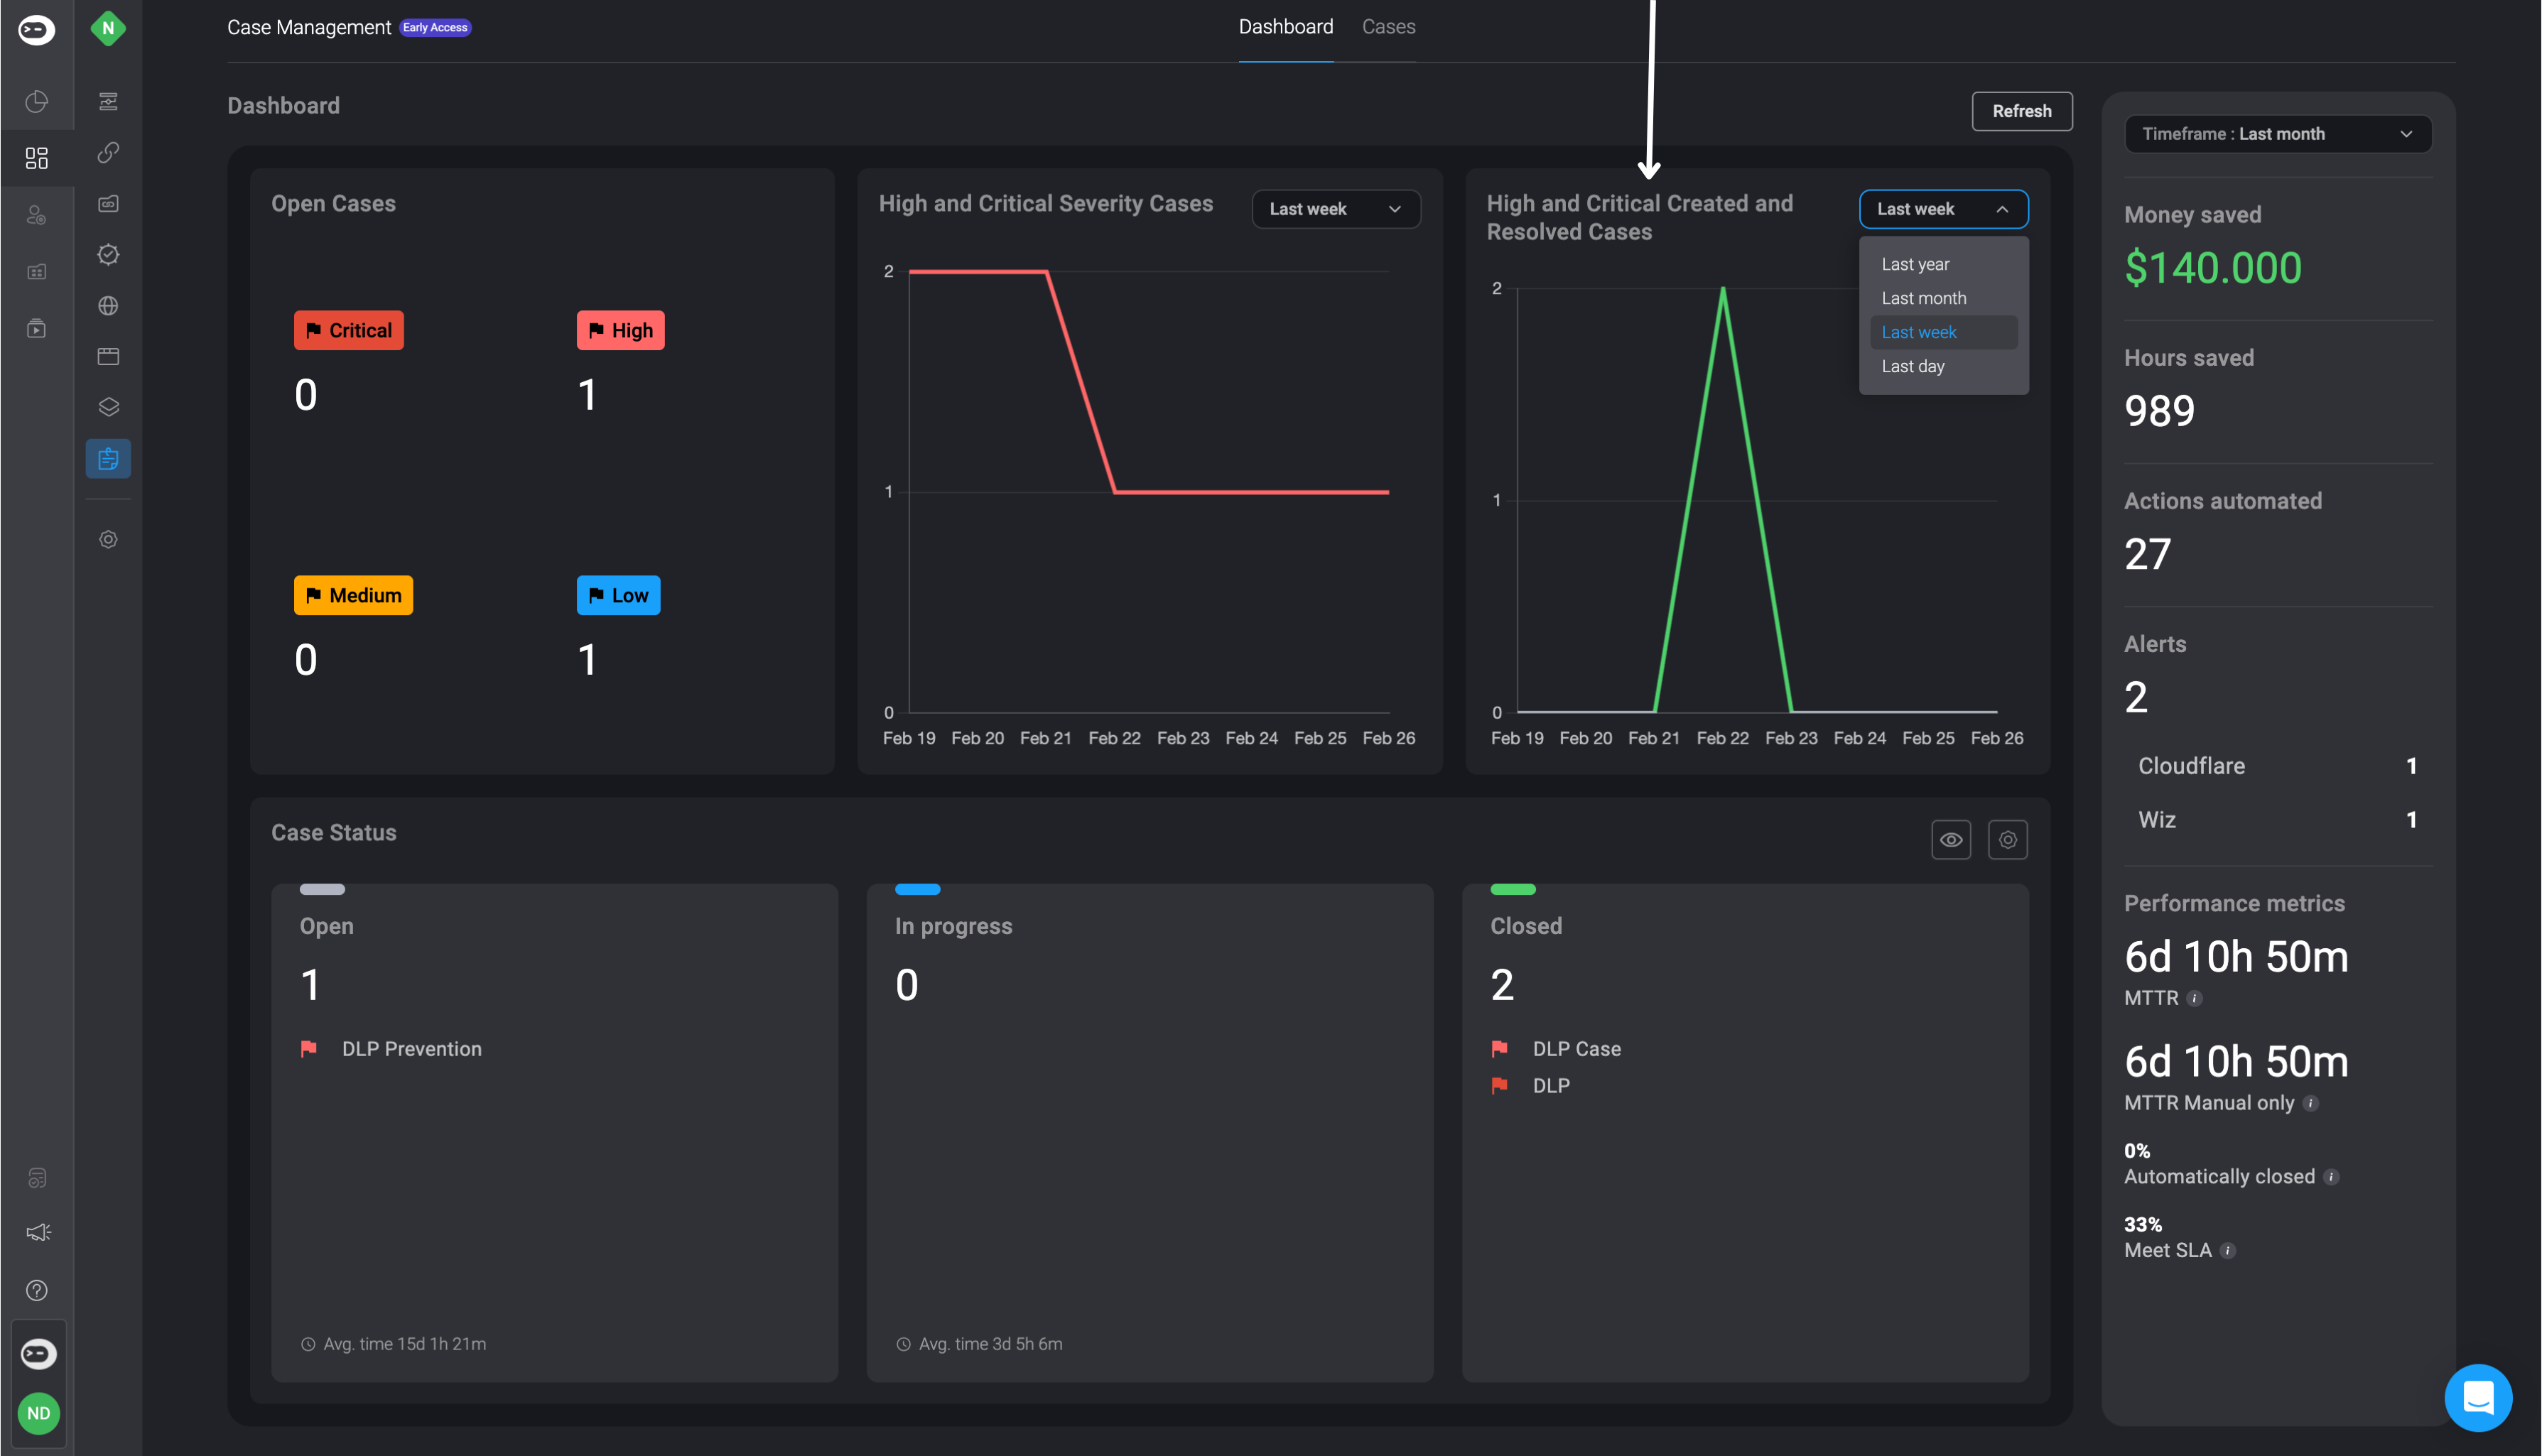
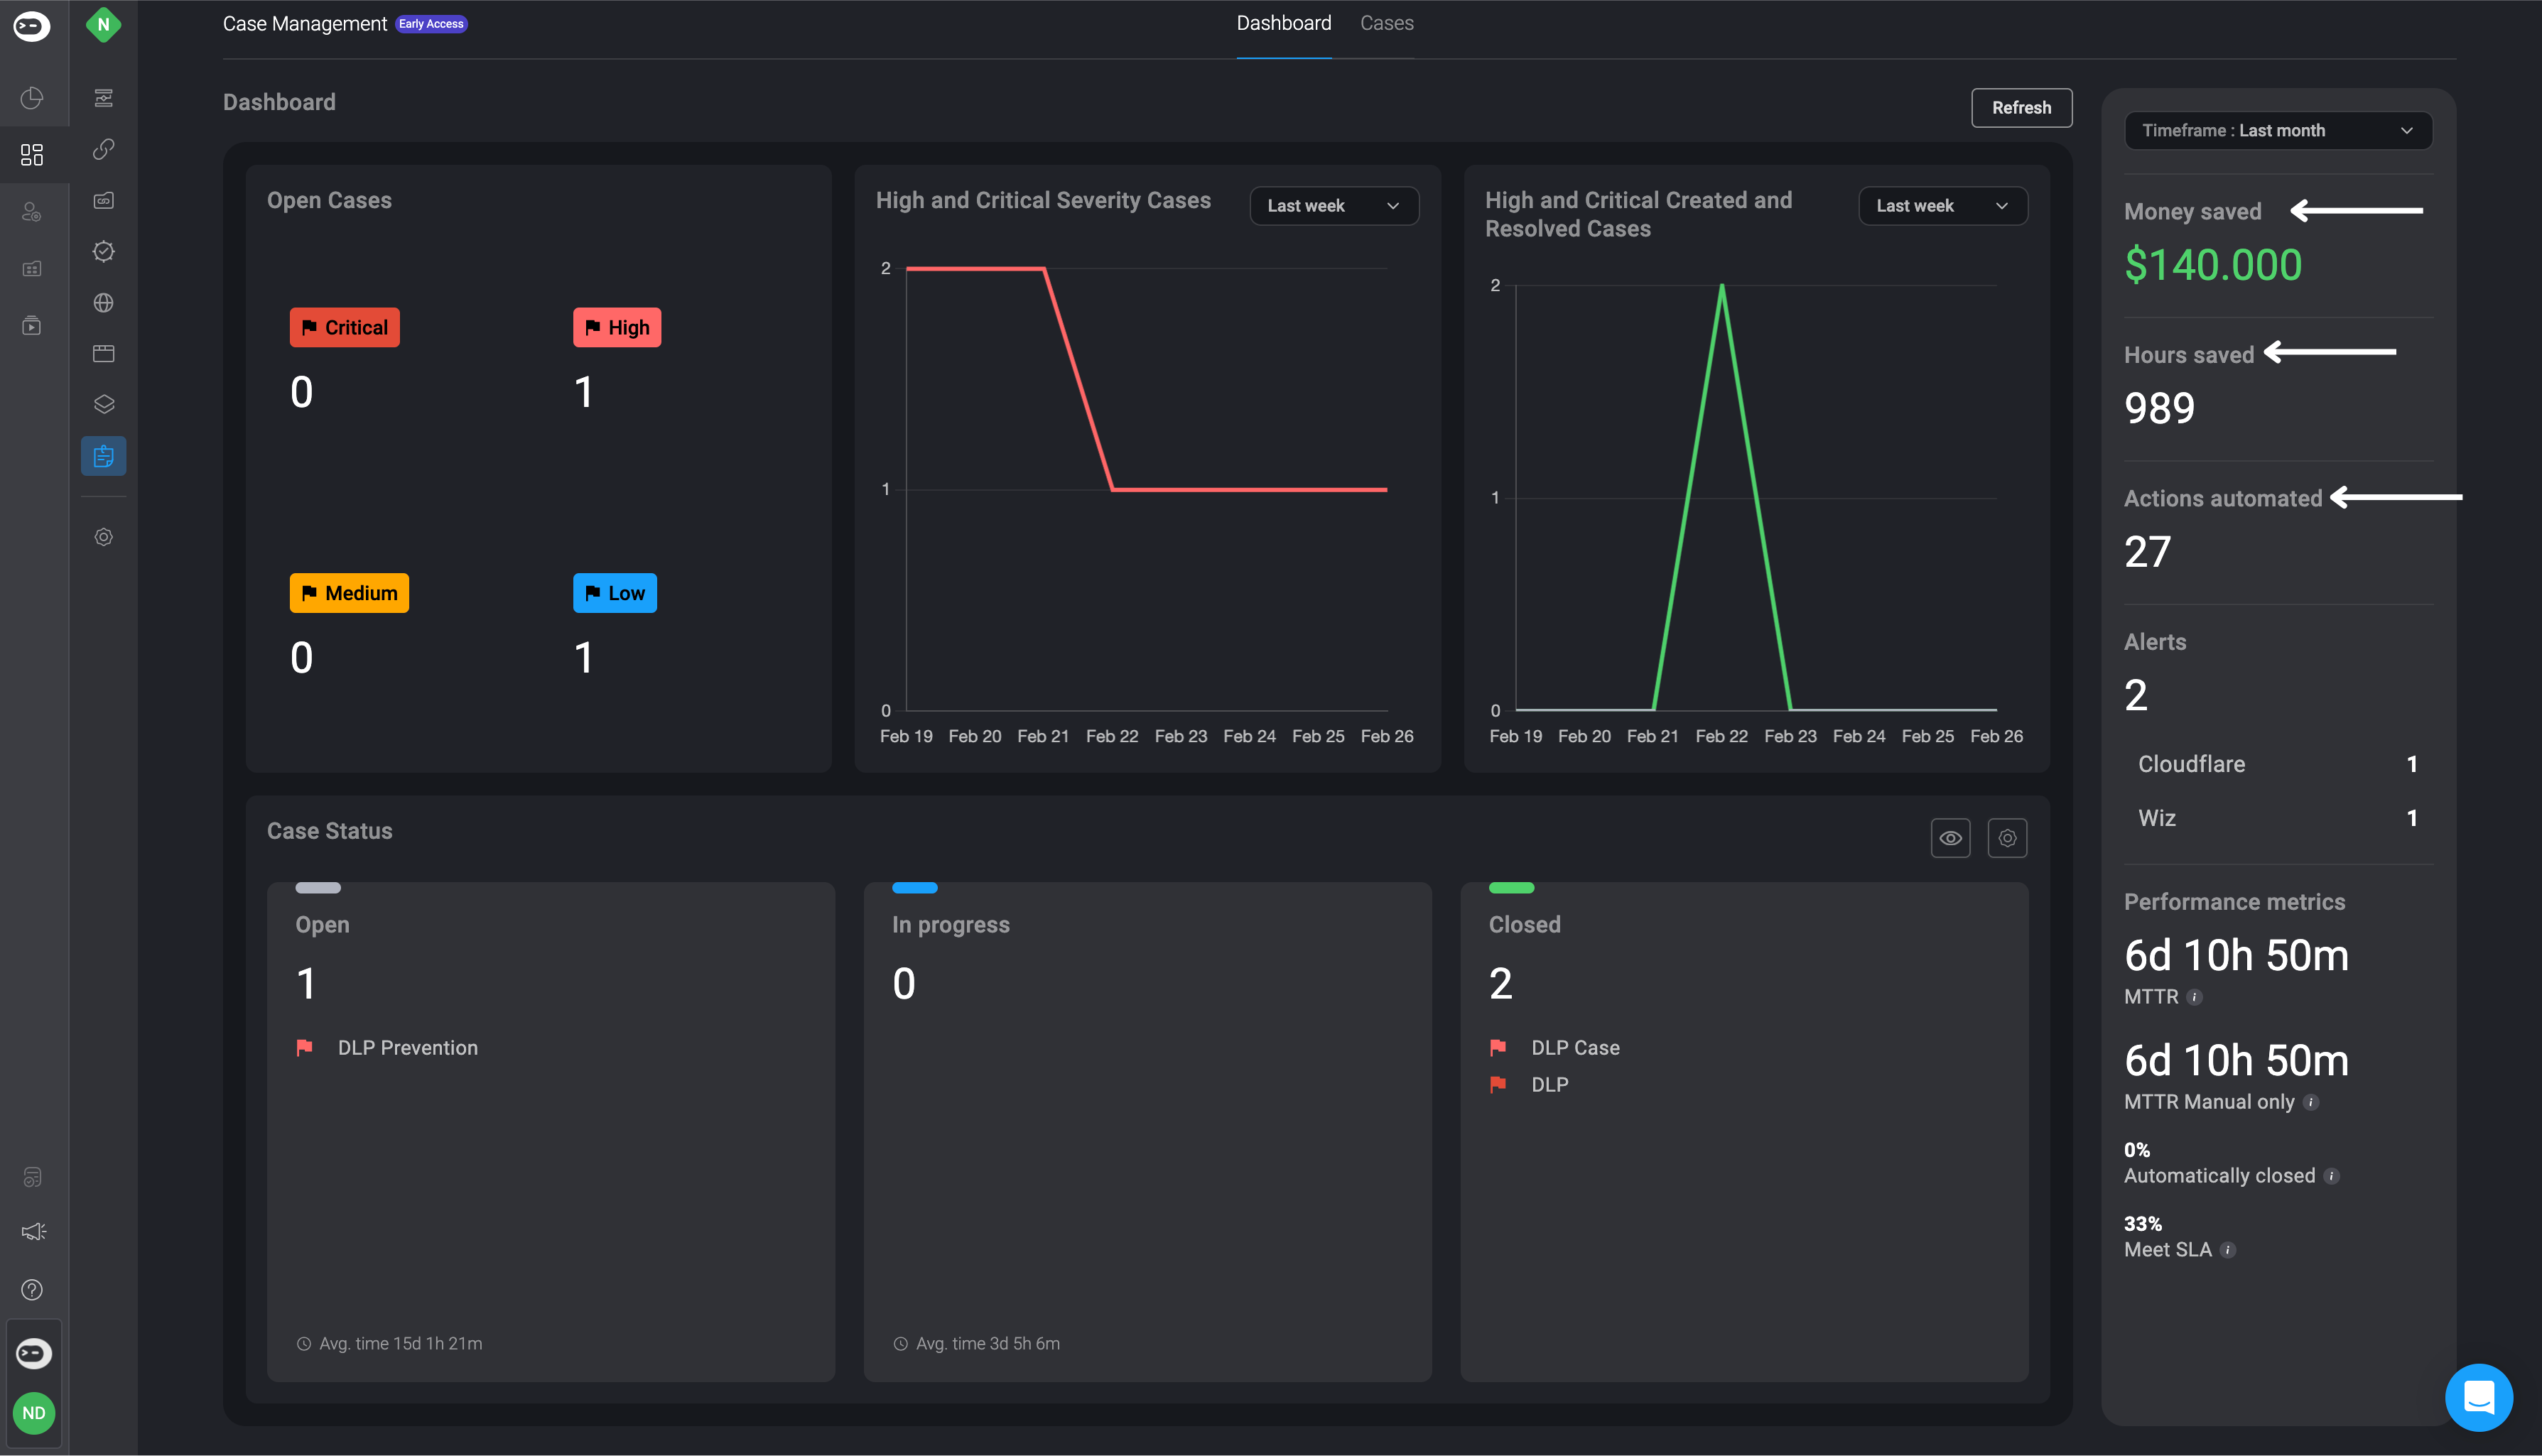
- The Case Management Dashboard also provides insights about the amount money saved, hours saved, actions automated using the Case Management feature in the current Workspace. You can customize the timeframe of the ROI calculation using the timeframe dropdown.
- The Case Management Dashboard also provides insights about your case's performance metrics.
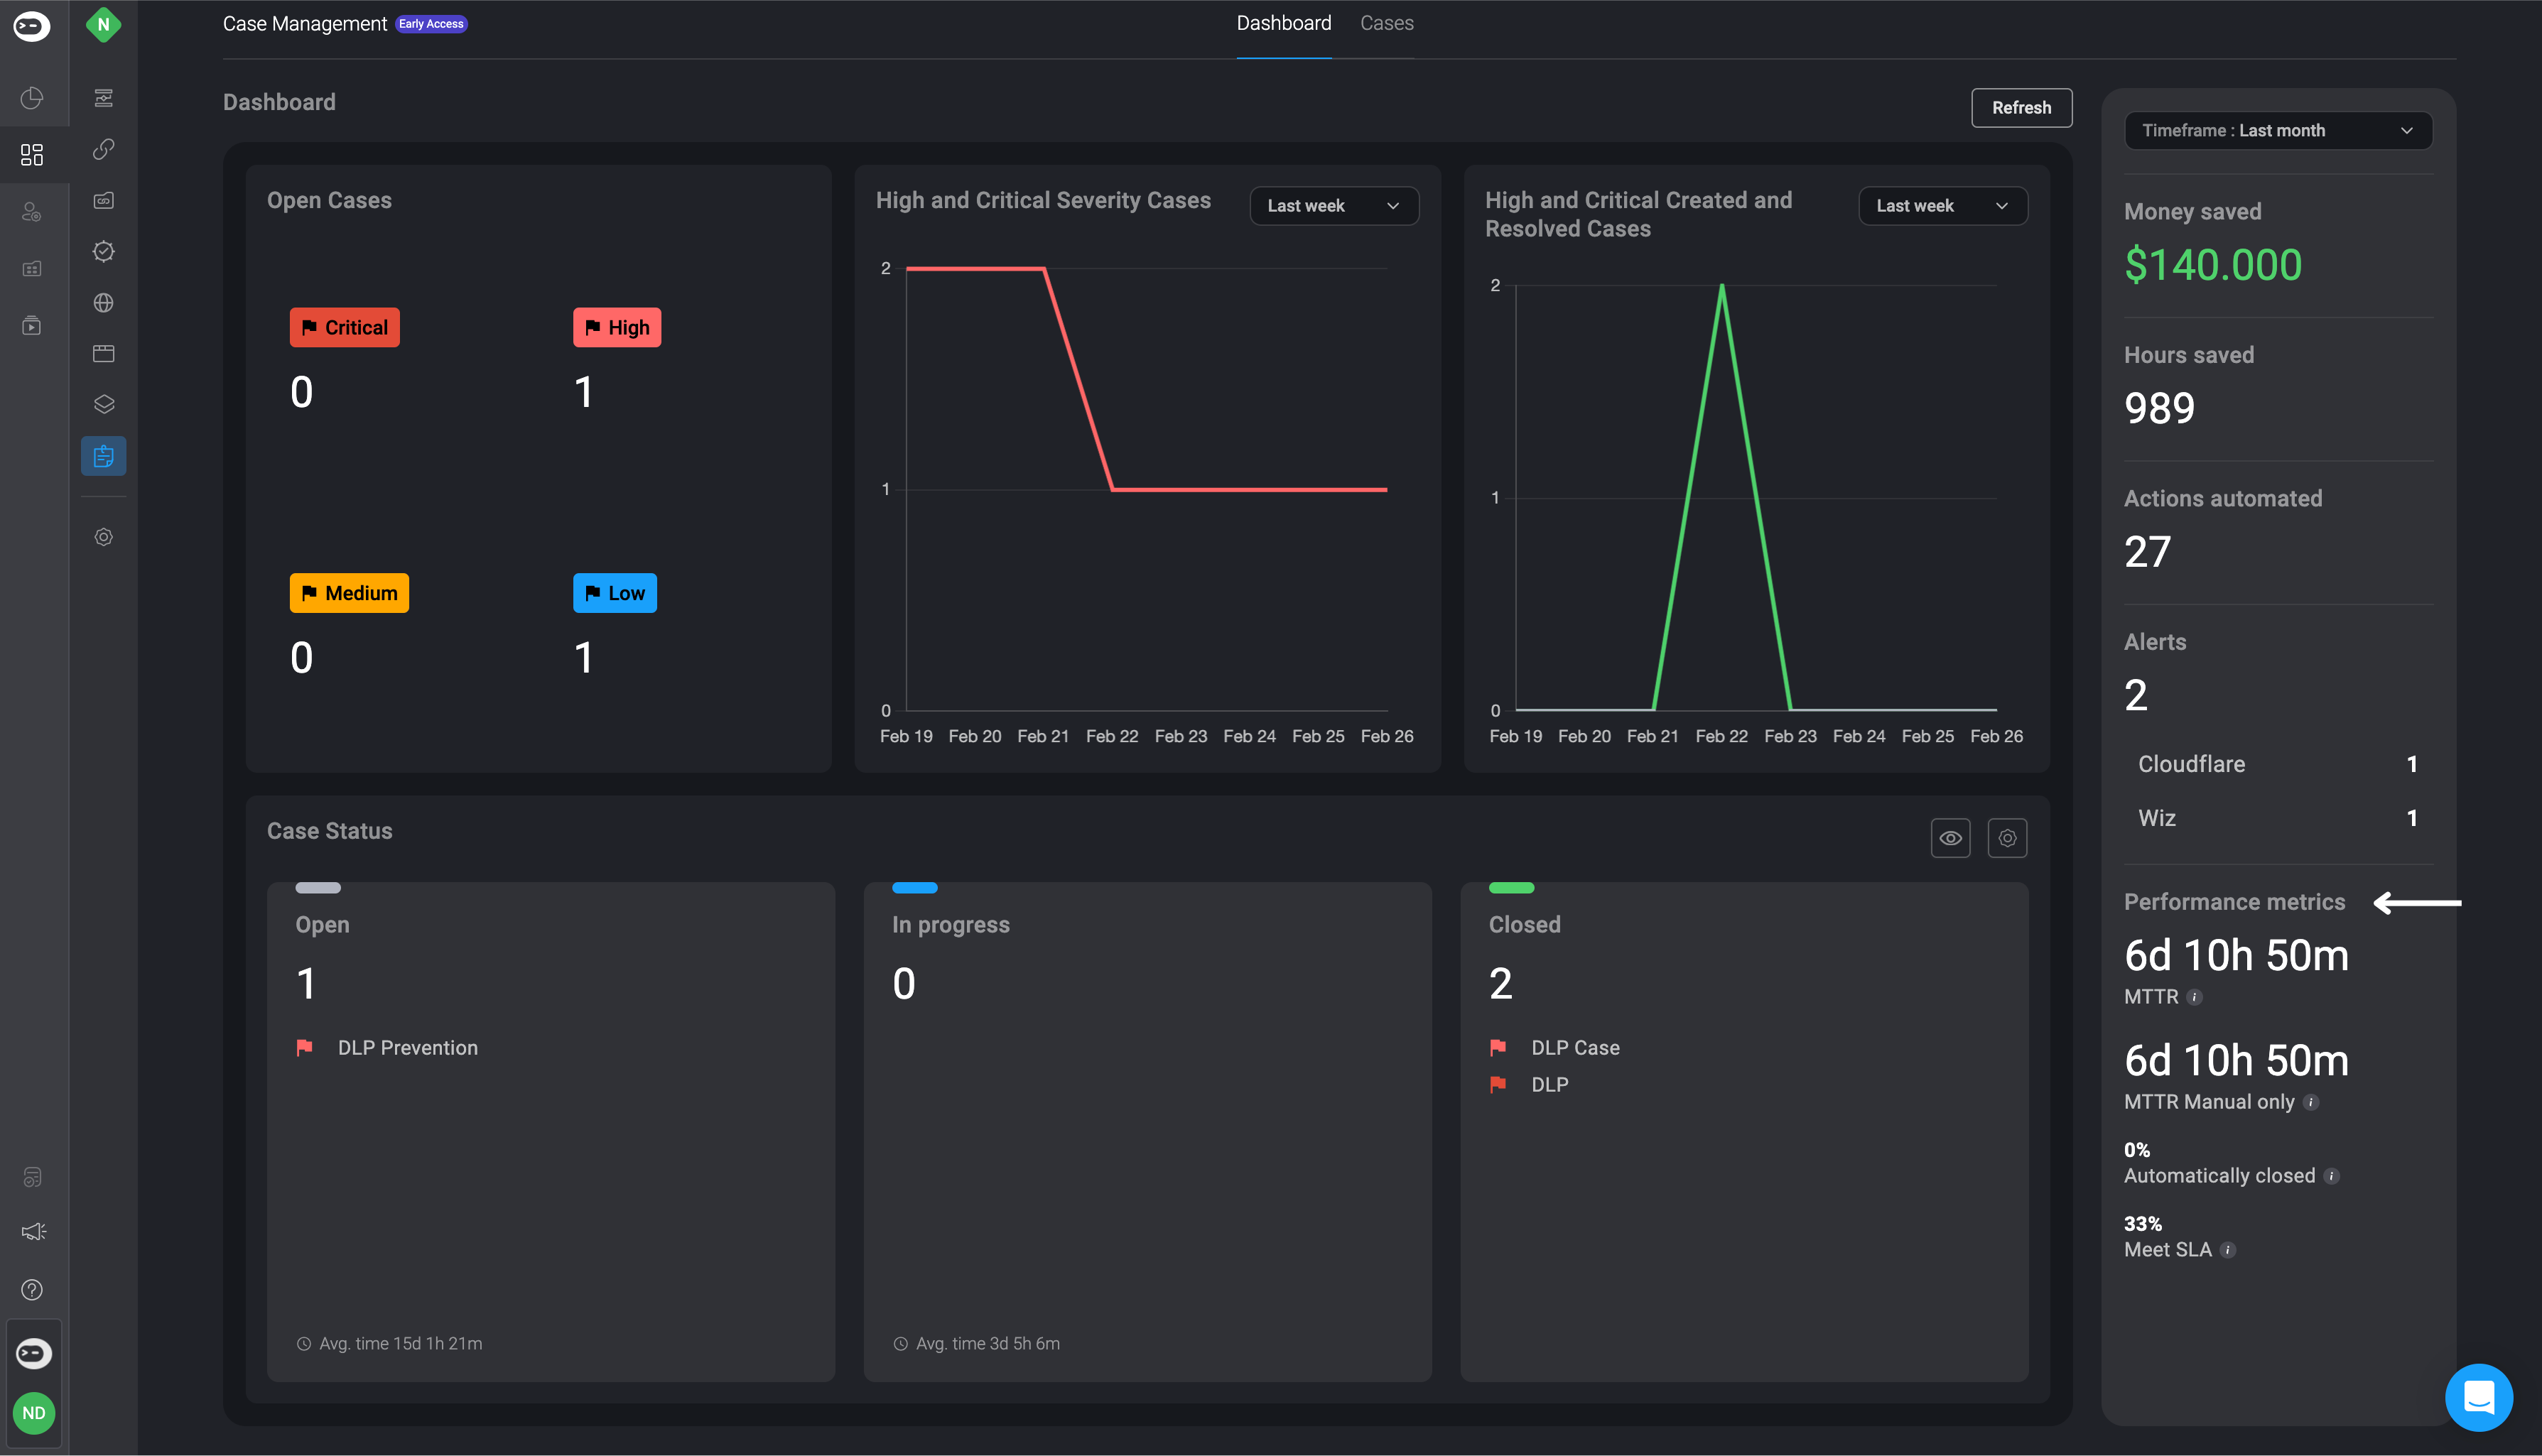
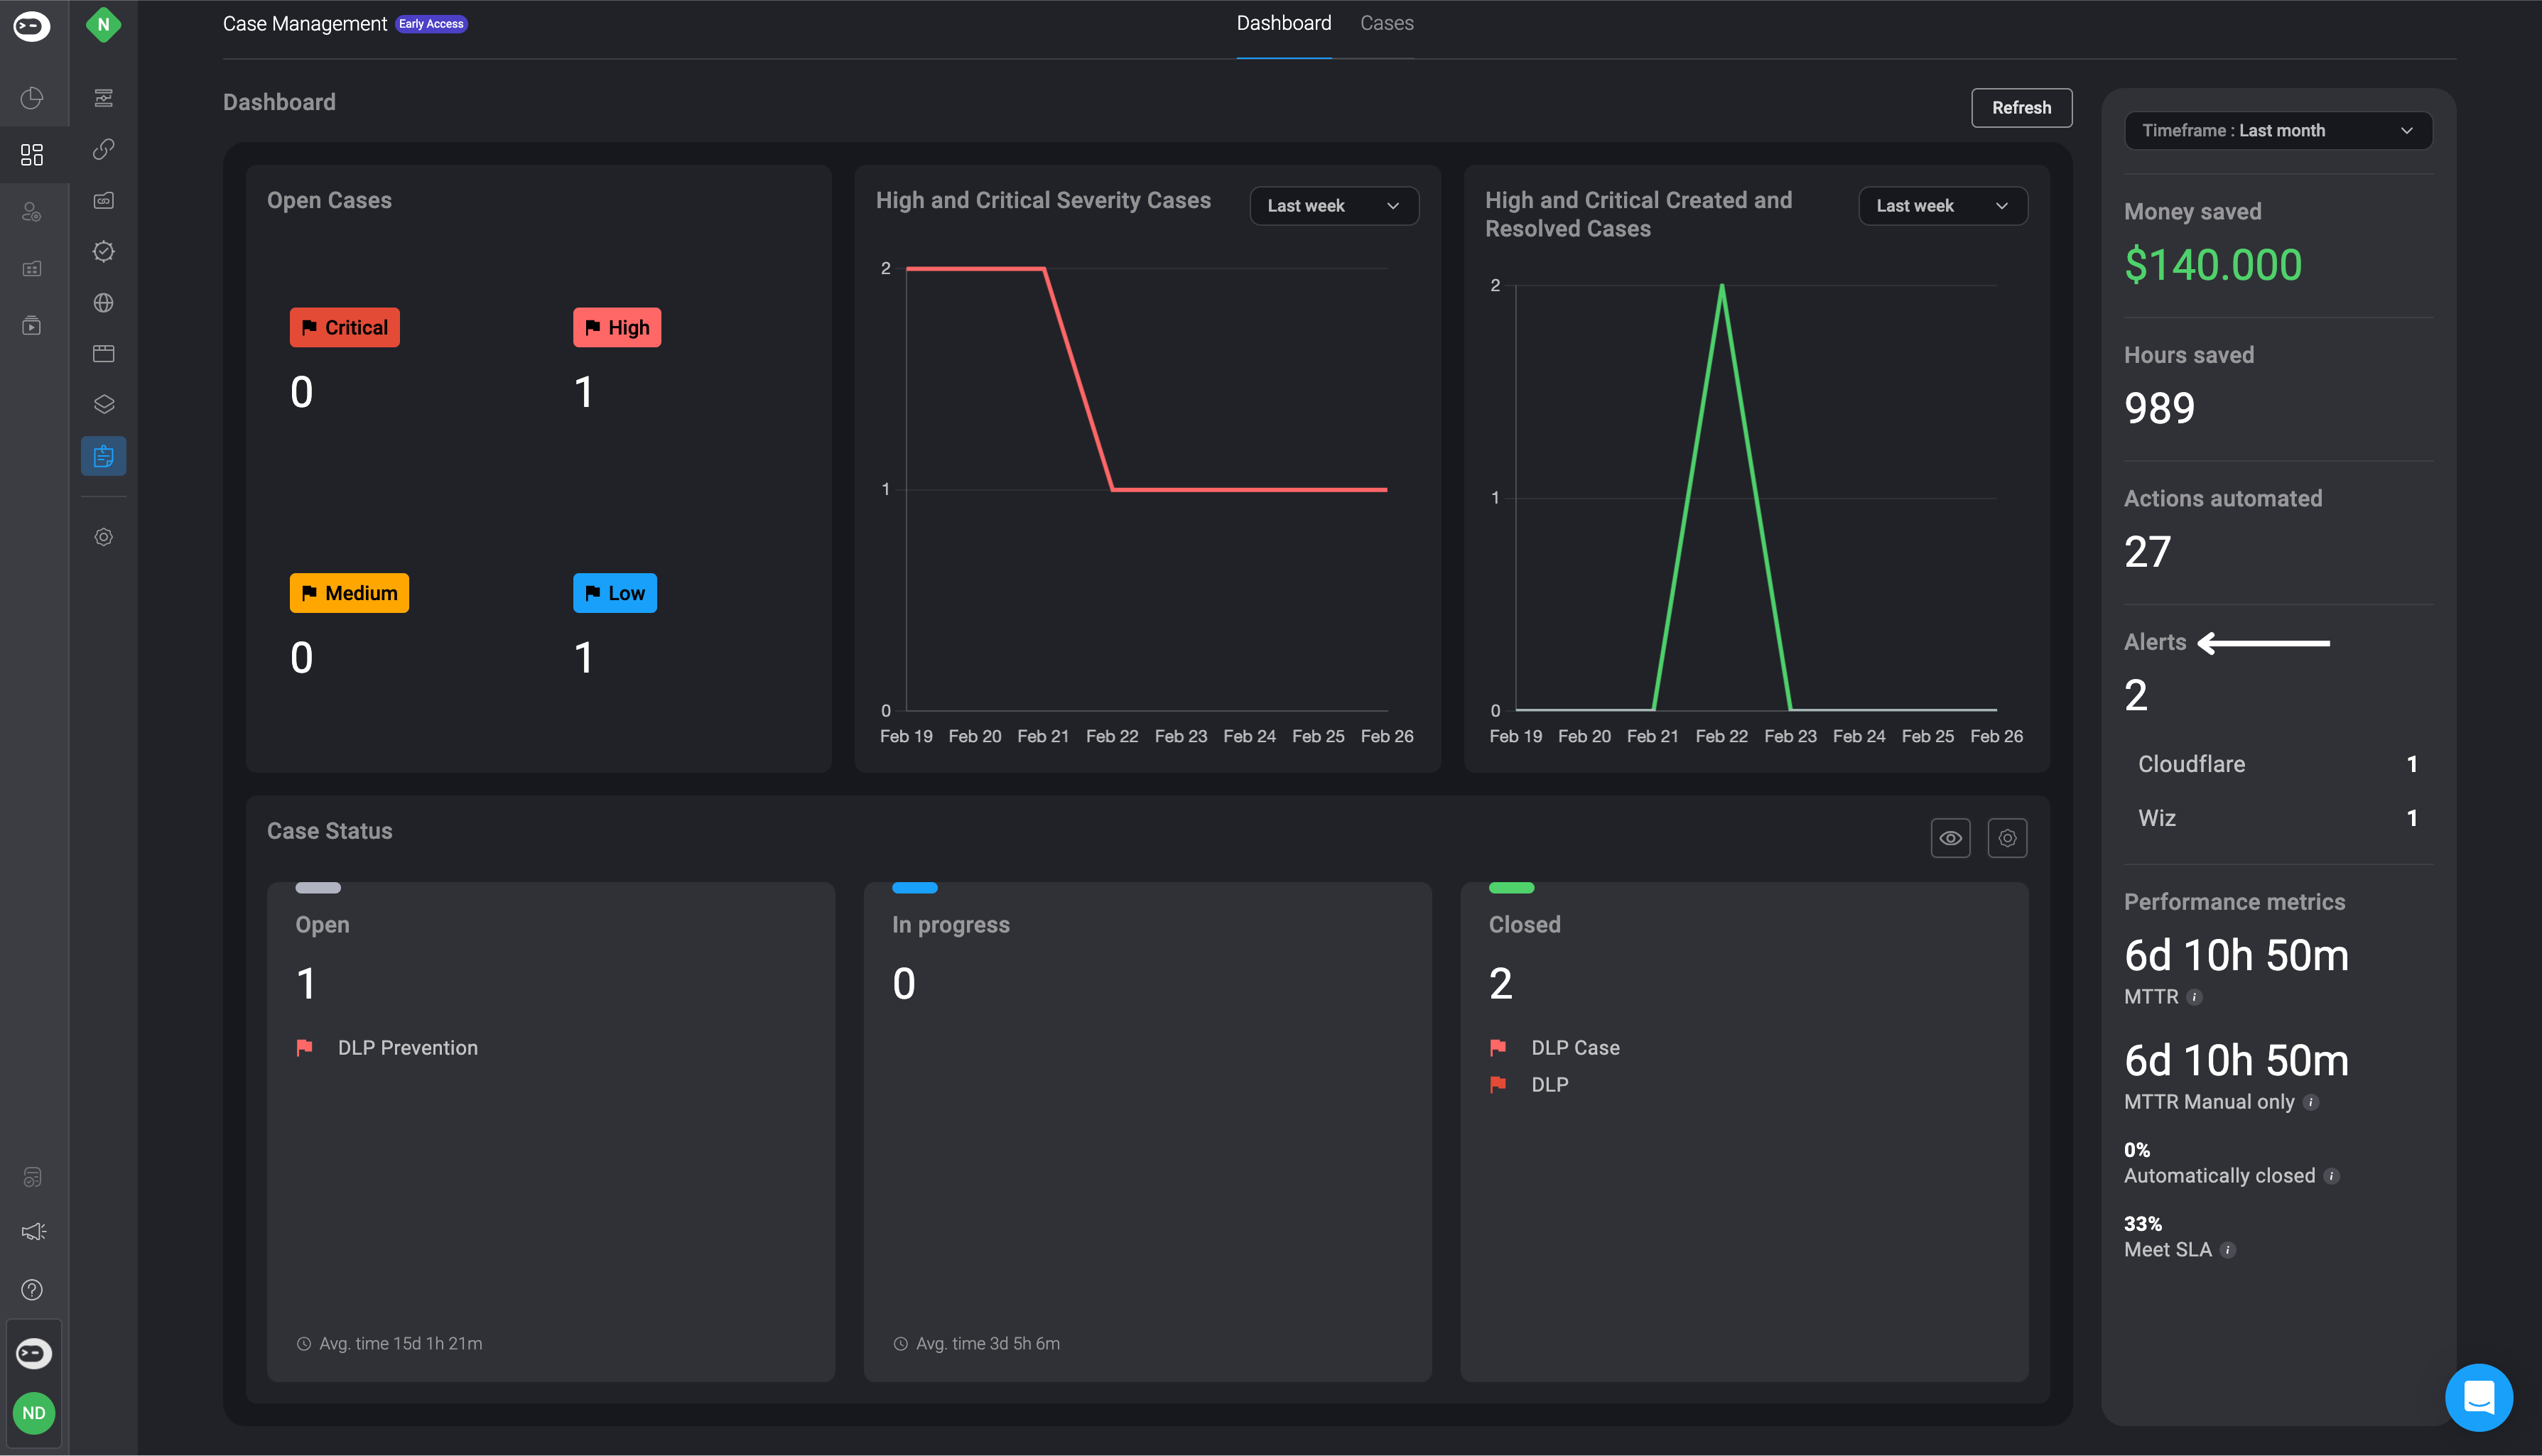
- The total number of Alerts created, along with a list of the Vendors associated with these Alerts.
- The Case Status information, detailing the number of Open, In Progress and Closed Cases, along with their average time spent in its respective status, measured in minutes.