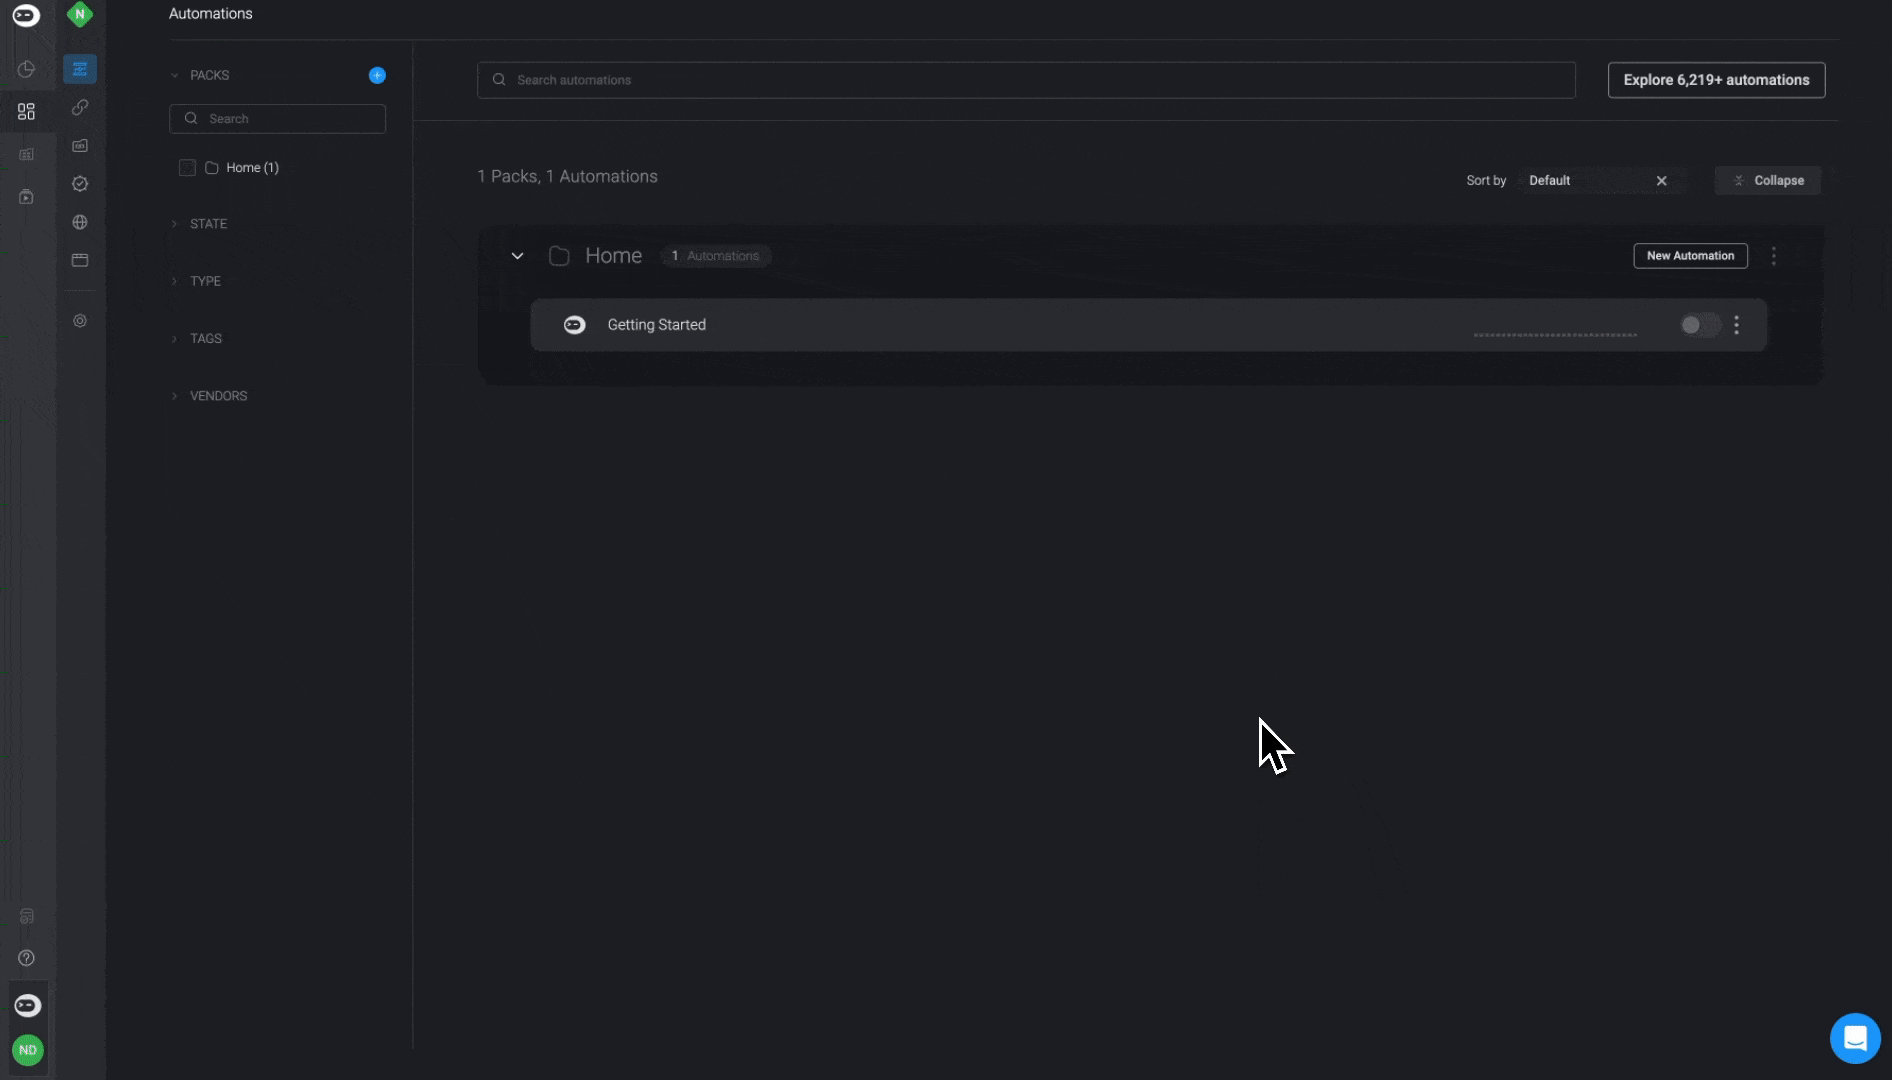
Automation Overview Page
Clicking on the Overview button on an Automation in a Pack will open the Automation Overview page. This page displays general information and settings of the Automation and allows you to edit these settings to meet your needs. On the left-hand side is a preview of the current published version of the selected automation.
Published automation versions may be different the the automation version in the editor.
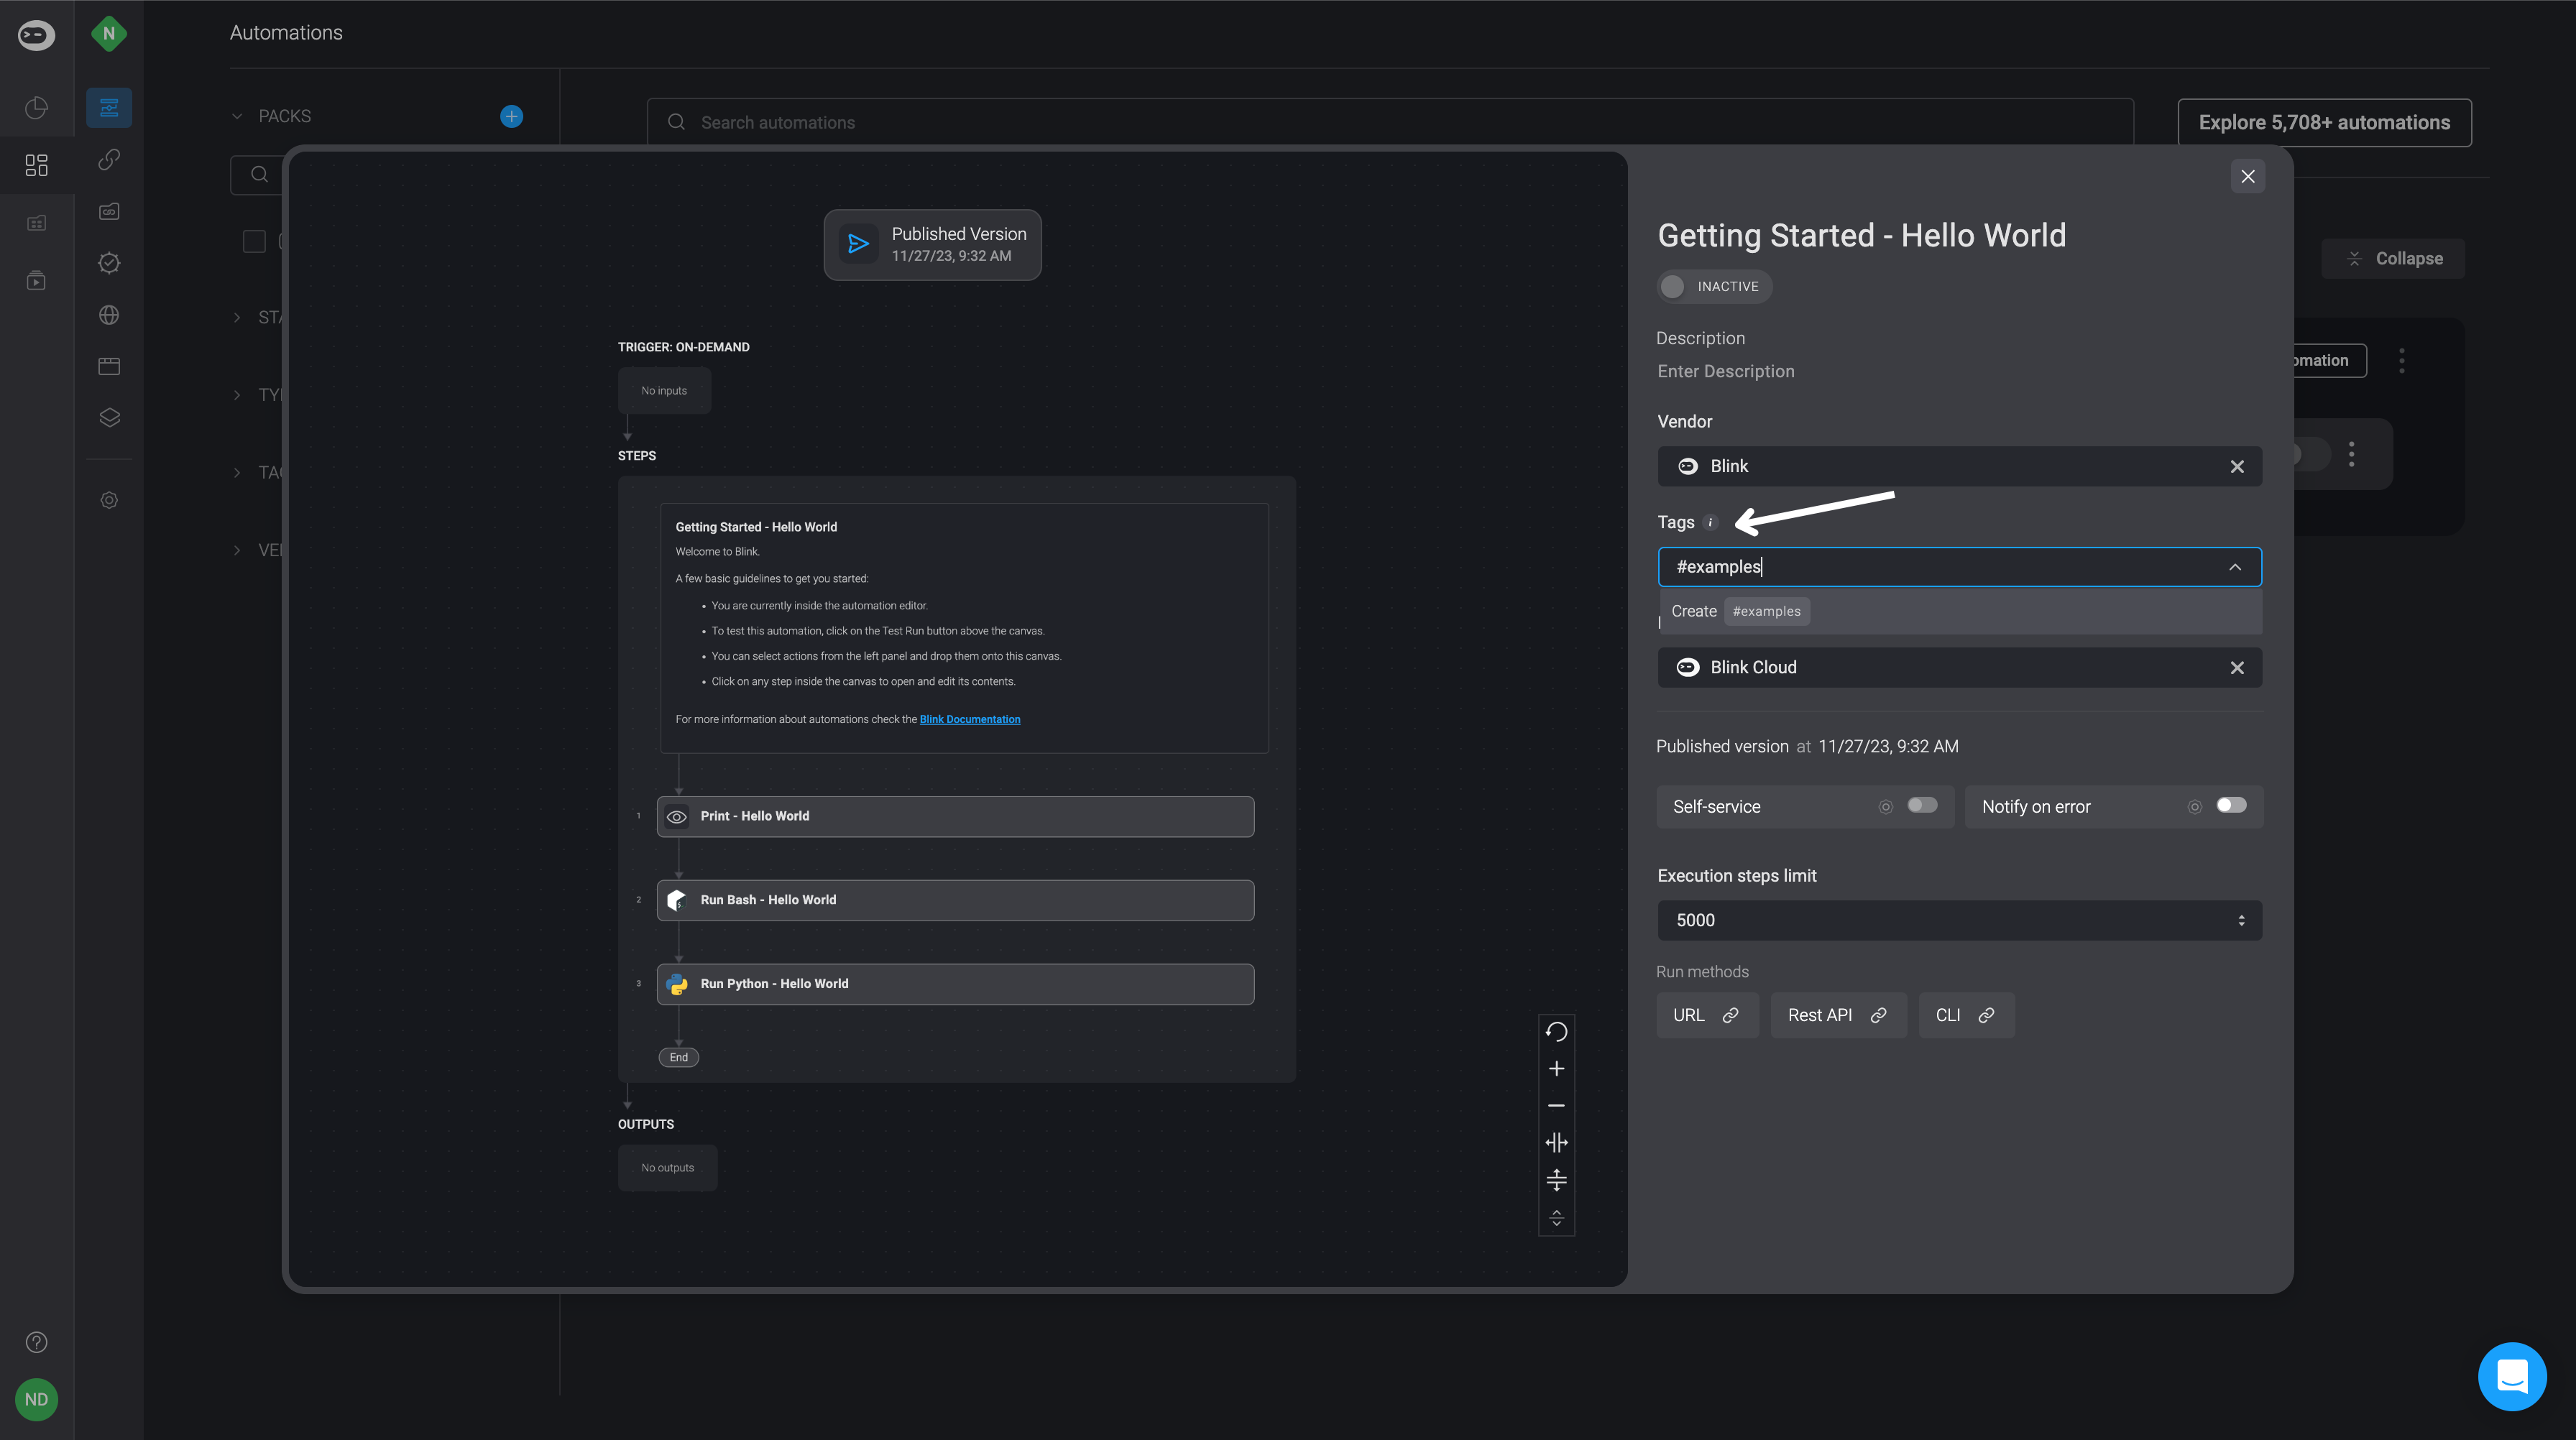
Overview of an Automation
| Parameter | Description |
|---|---|
| Automation name | Name of the Automation. |
| Active/Inactive | Published automations can be switched between active or inactive mode. |
| Description | Description of the Automation. |
| Vendor | The Vendor icon associated with the automation. |
| Tags | Tags used to easily search for the Automation. |
| Runner | Environment in which the Automation is run. The default runner that is used is Blink-Cloud. |
| Serial Automation Runs | When a automation is set to run in serial, it executes runes one after another in the order of occurrence. When turned off, the automation execution run in parallel and immediately when triggered |
| Run methods | Methods to run an Automation (depending on the trigger type). |
| Self service | Exposes or hides the Automation in the Self-service portal. |
| Notify on error | Email address for notifications if errors occur during an execution. |
| Run workflow on error | Enables a workflow to run when there is an error during an execution. |
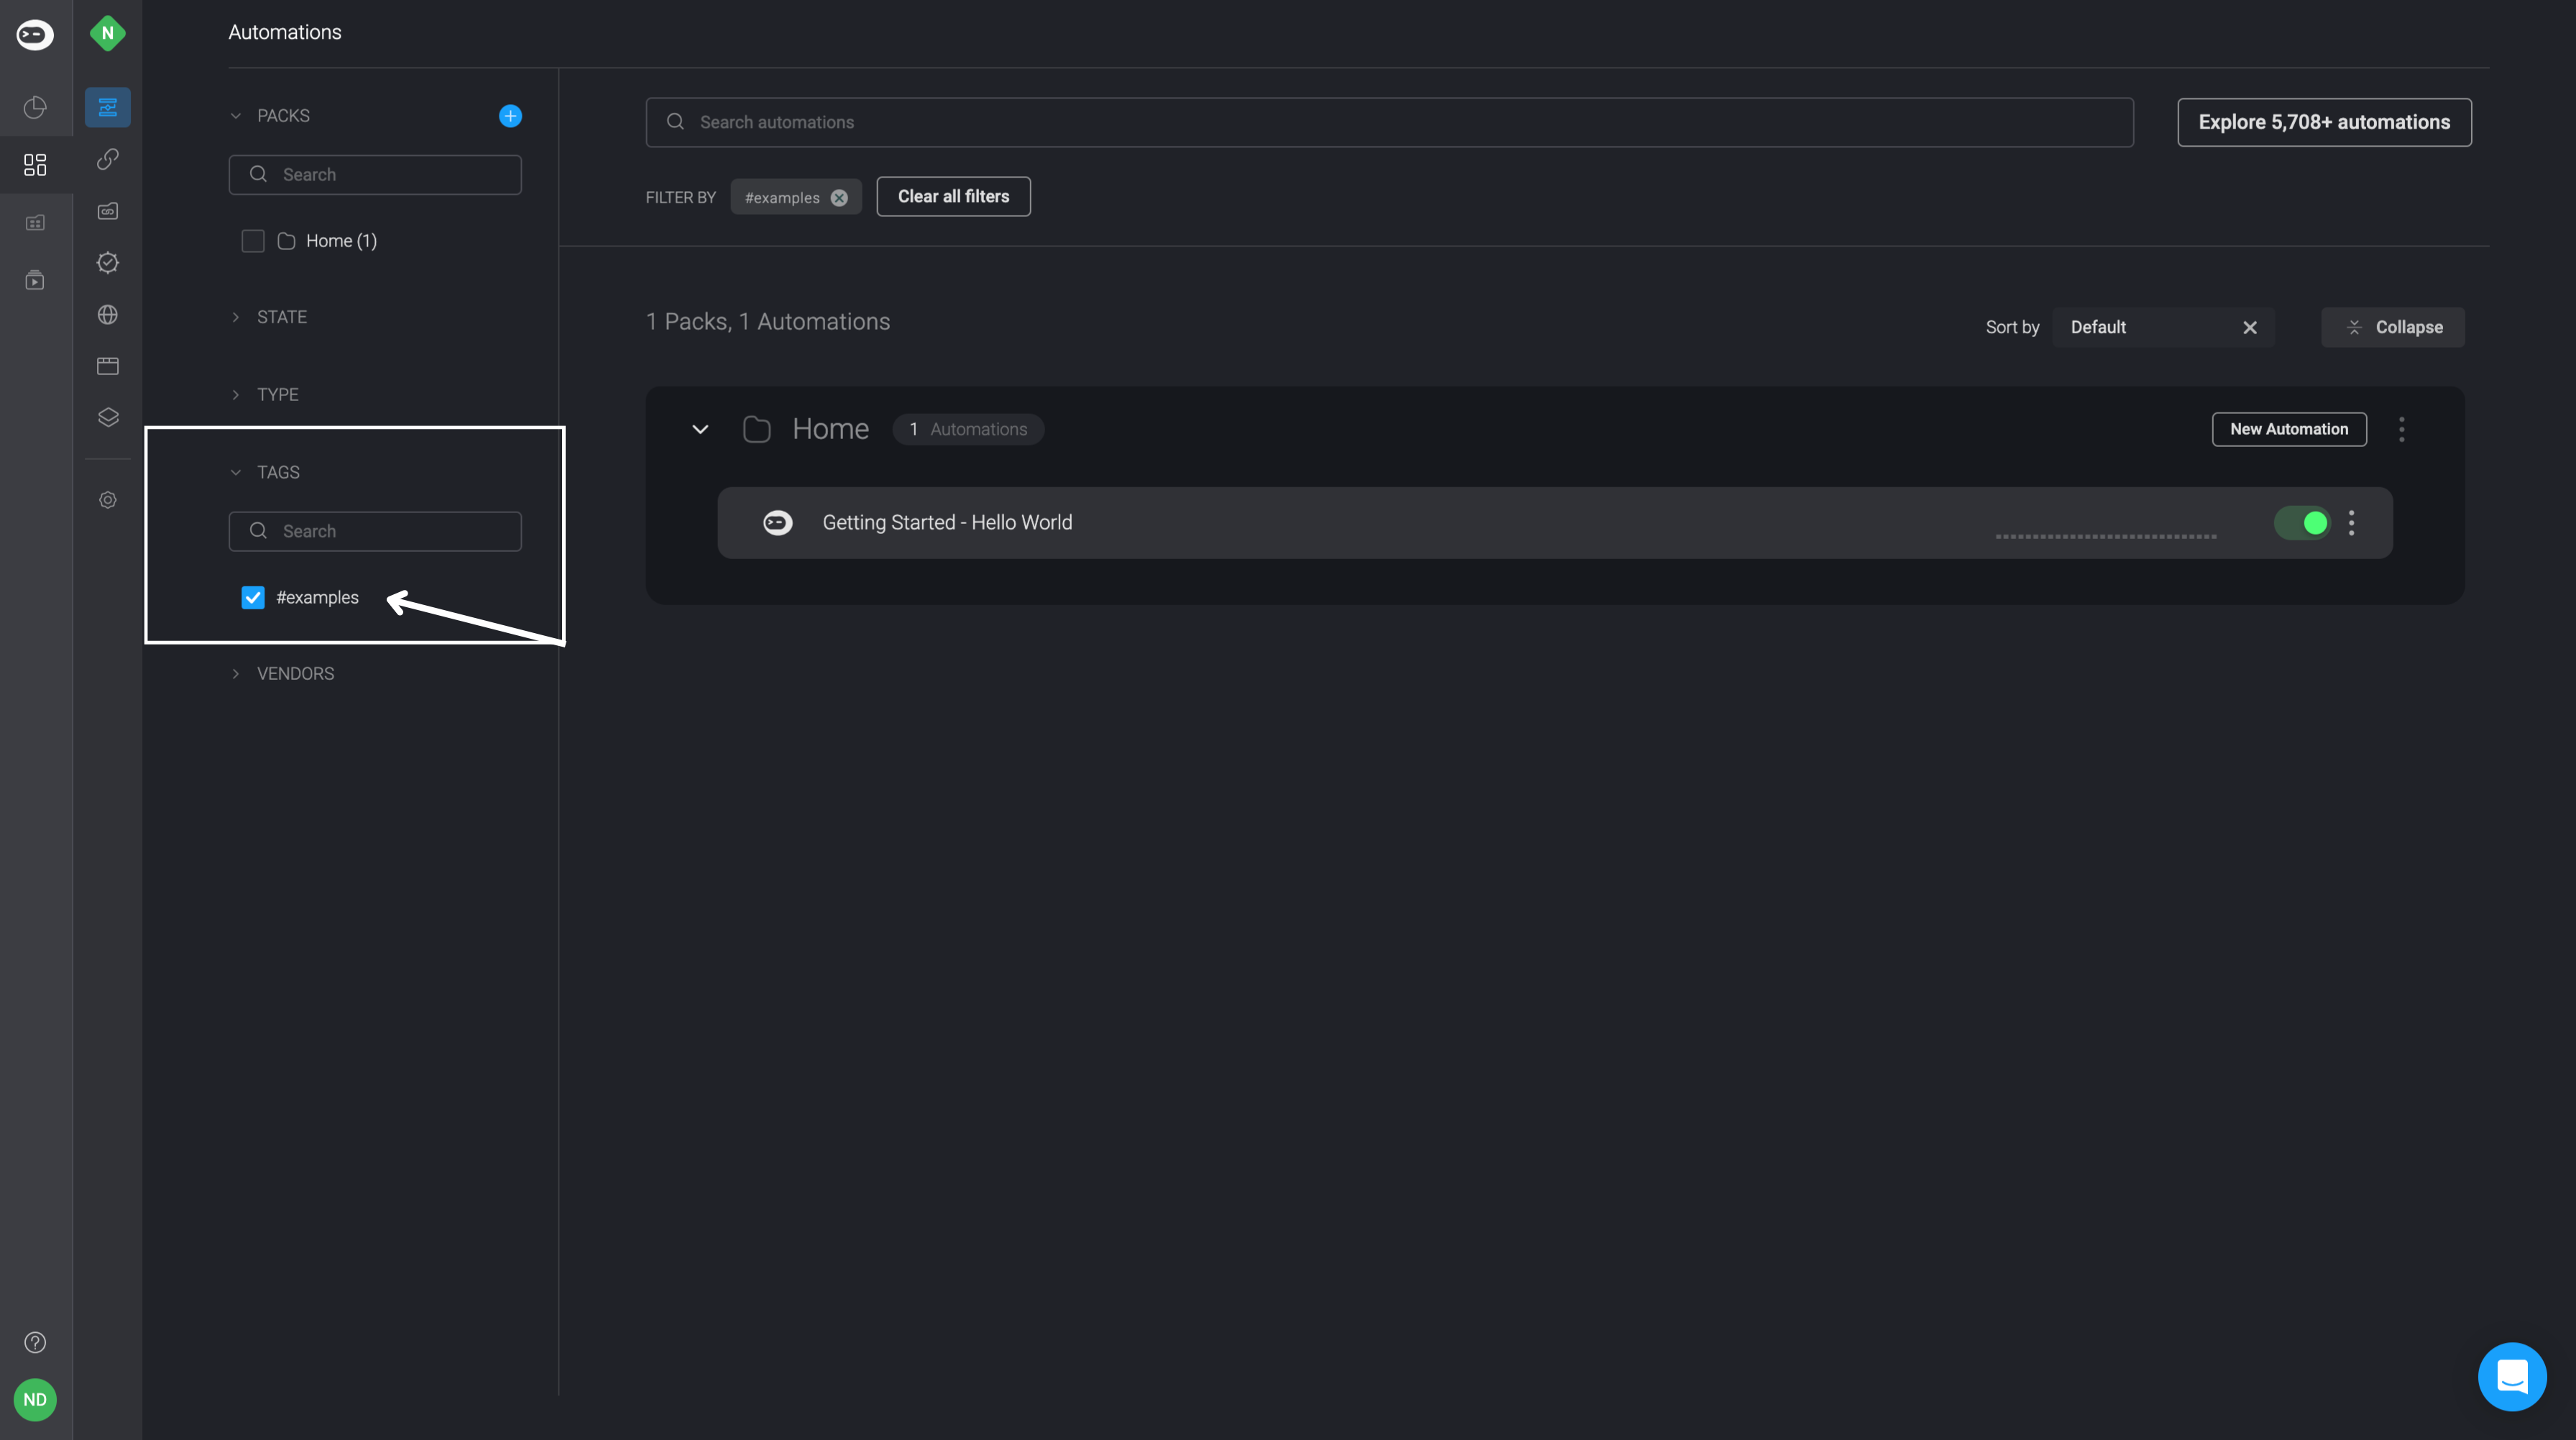
Filtering an Automation by Tags
- In the Tags section of the automation overview , you also have the option to create you own tags for the automation by entering a tag name of your choice.
- After creating a tag, you can simply locate it in the Tags section on the left-hand sidebar of the Automations page. Use this tag to easily search or filter the desired Automation in both the automations list and the self-service portal.
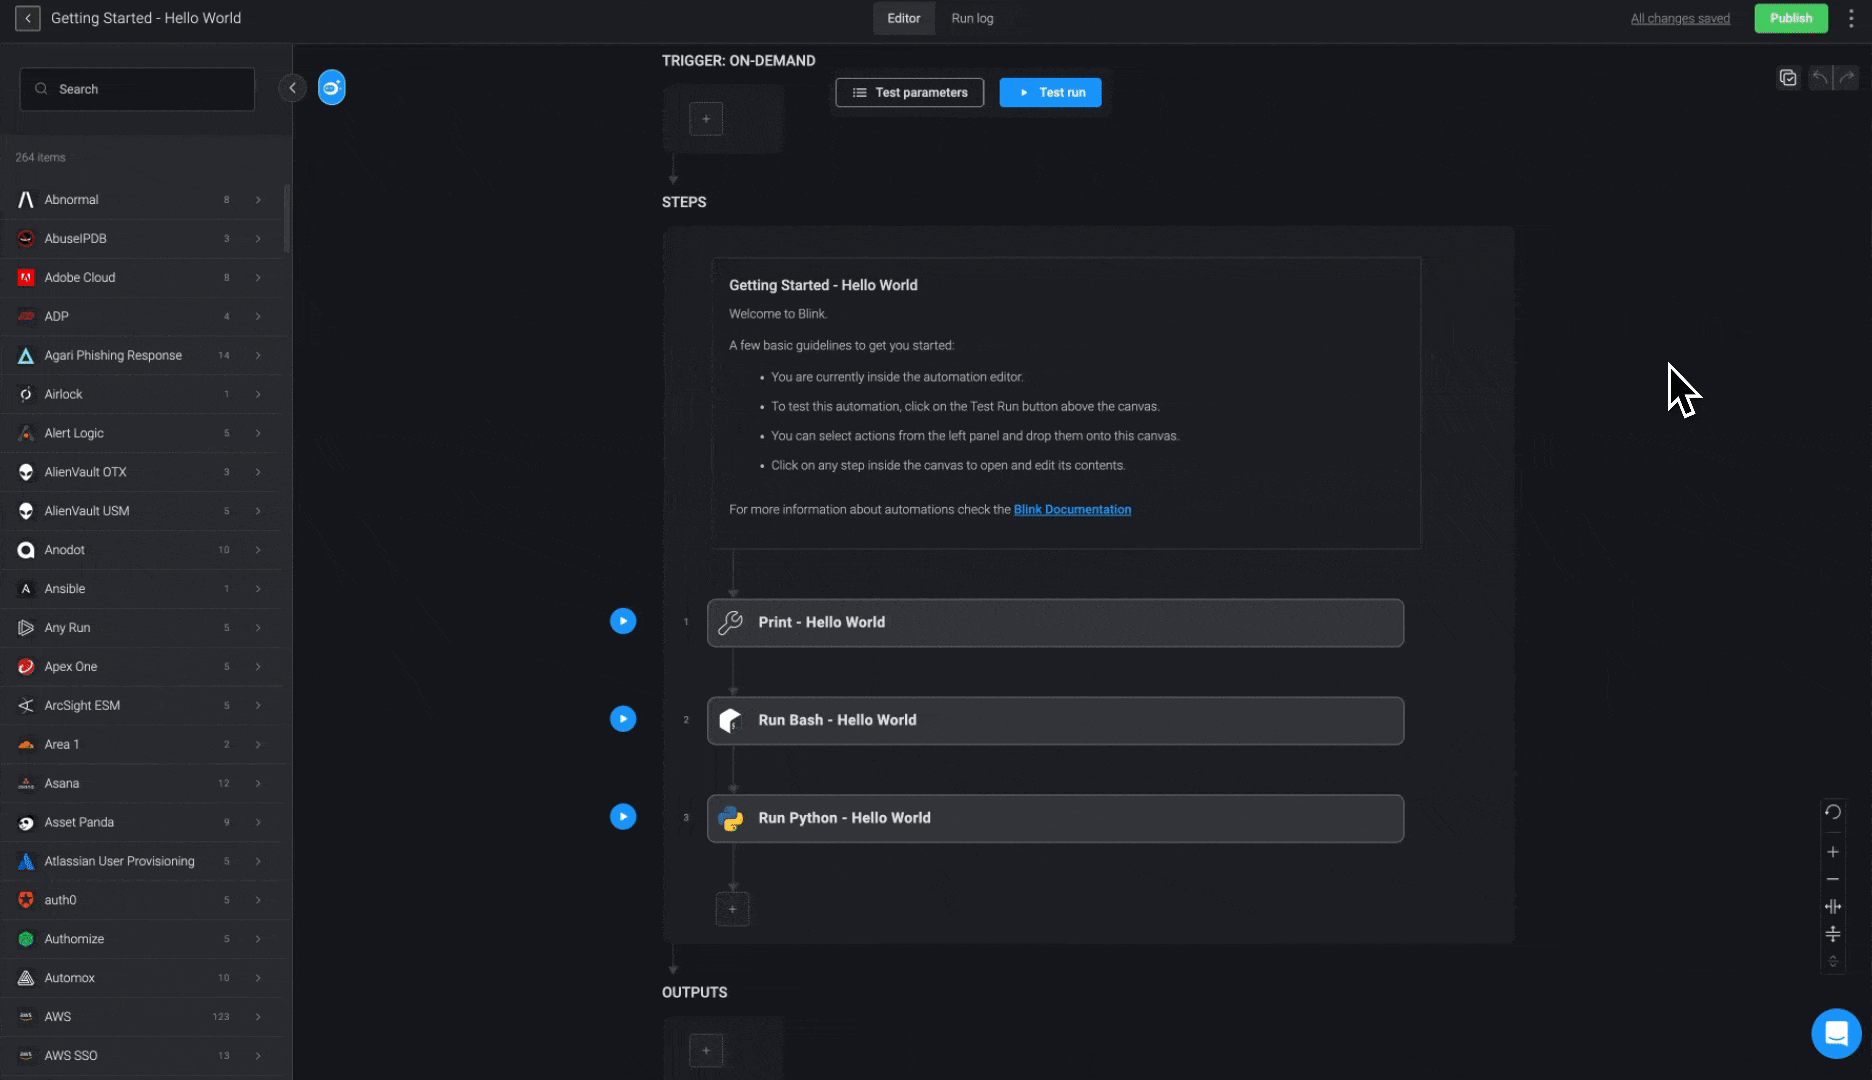
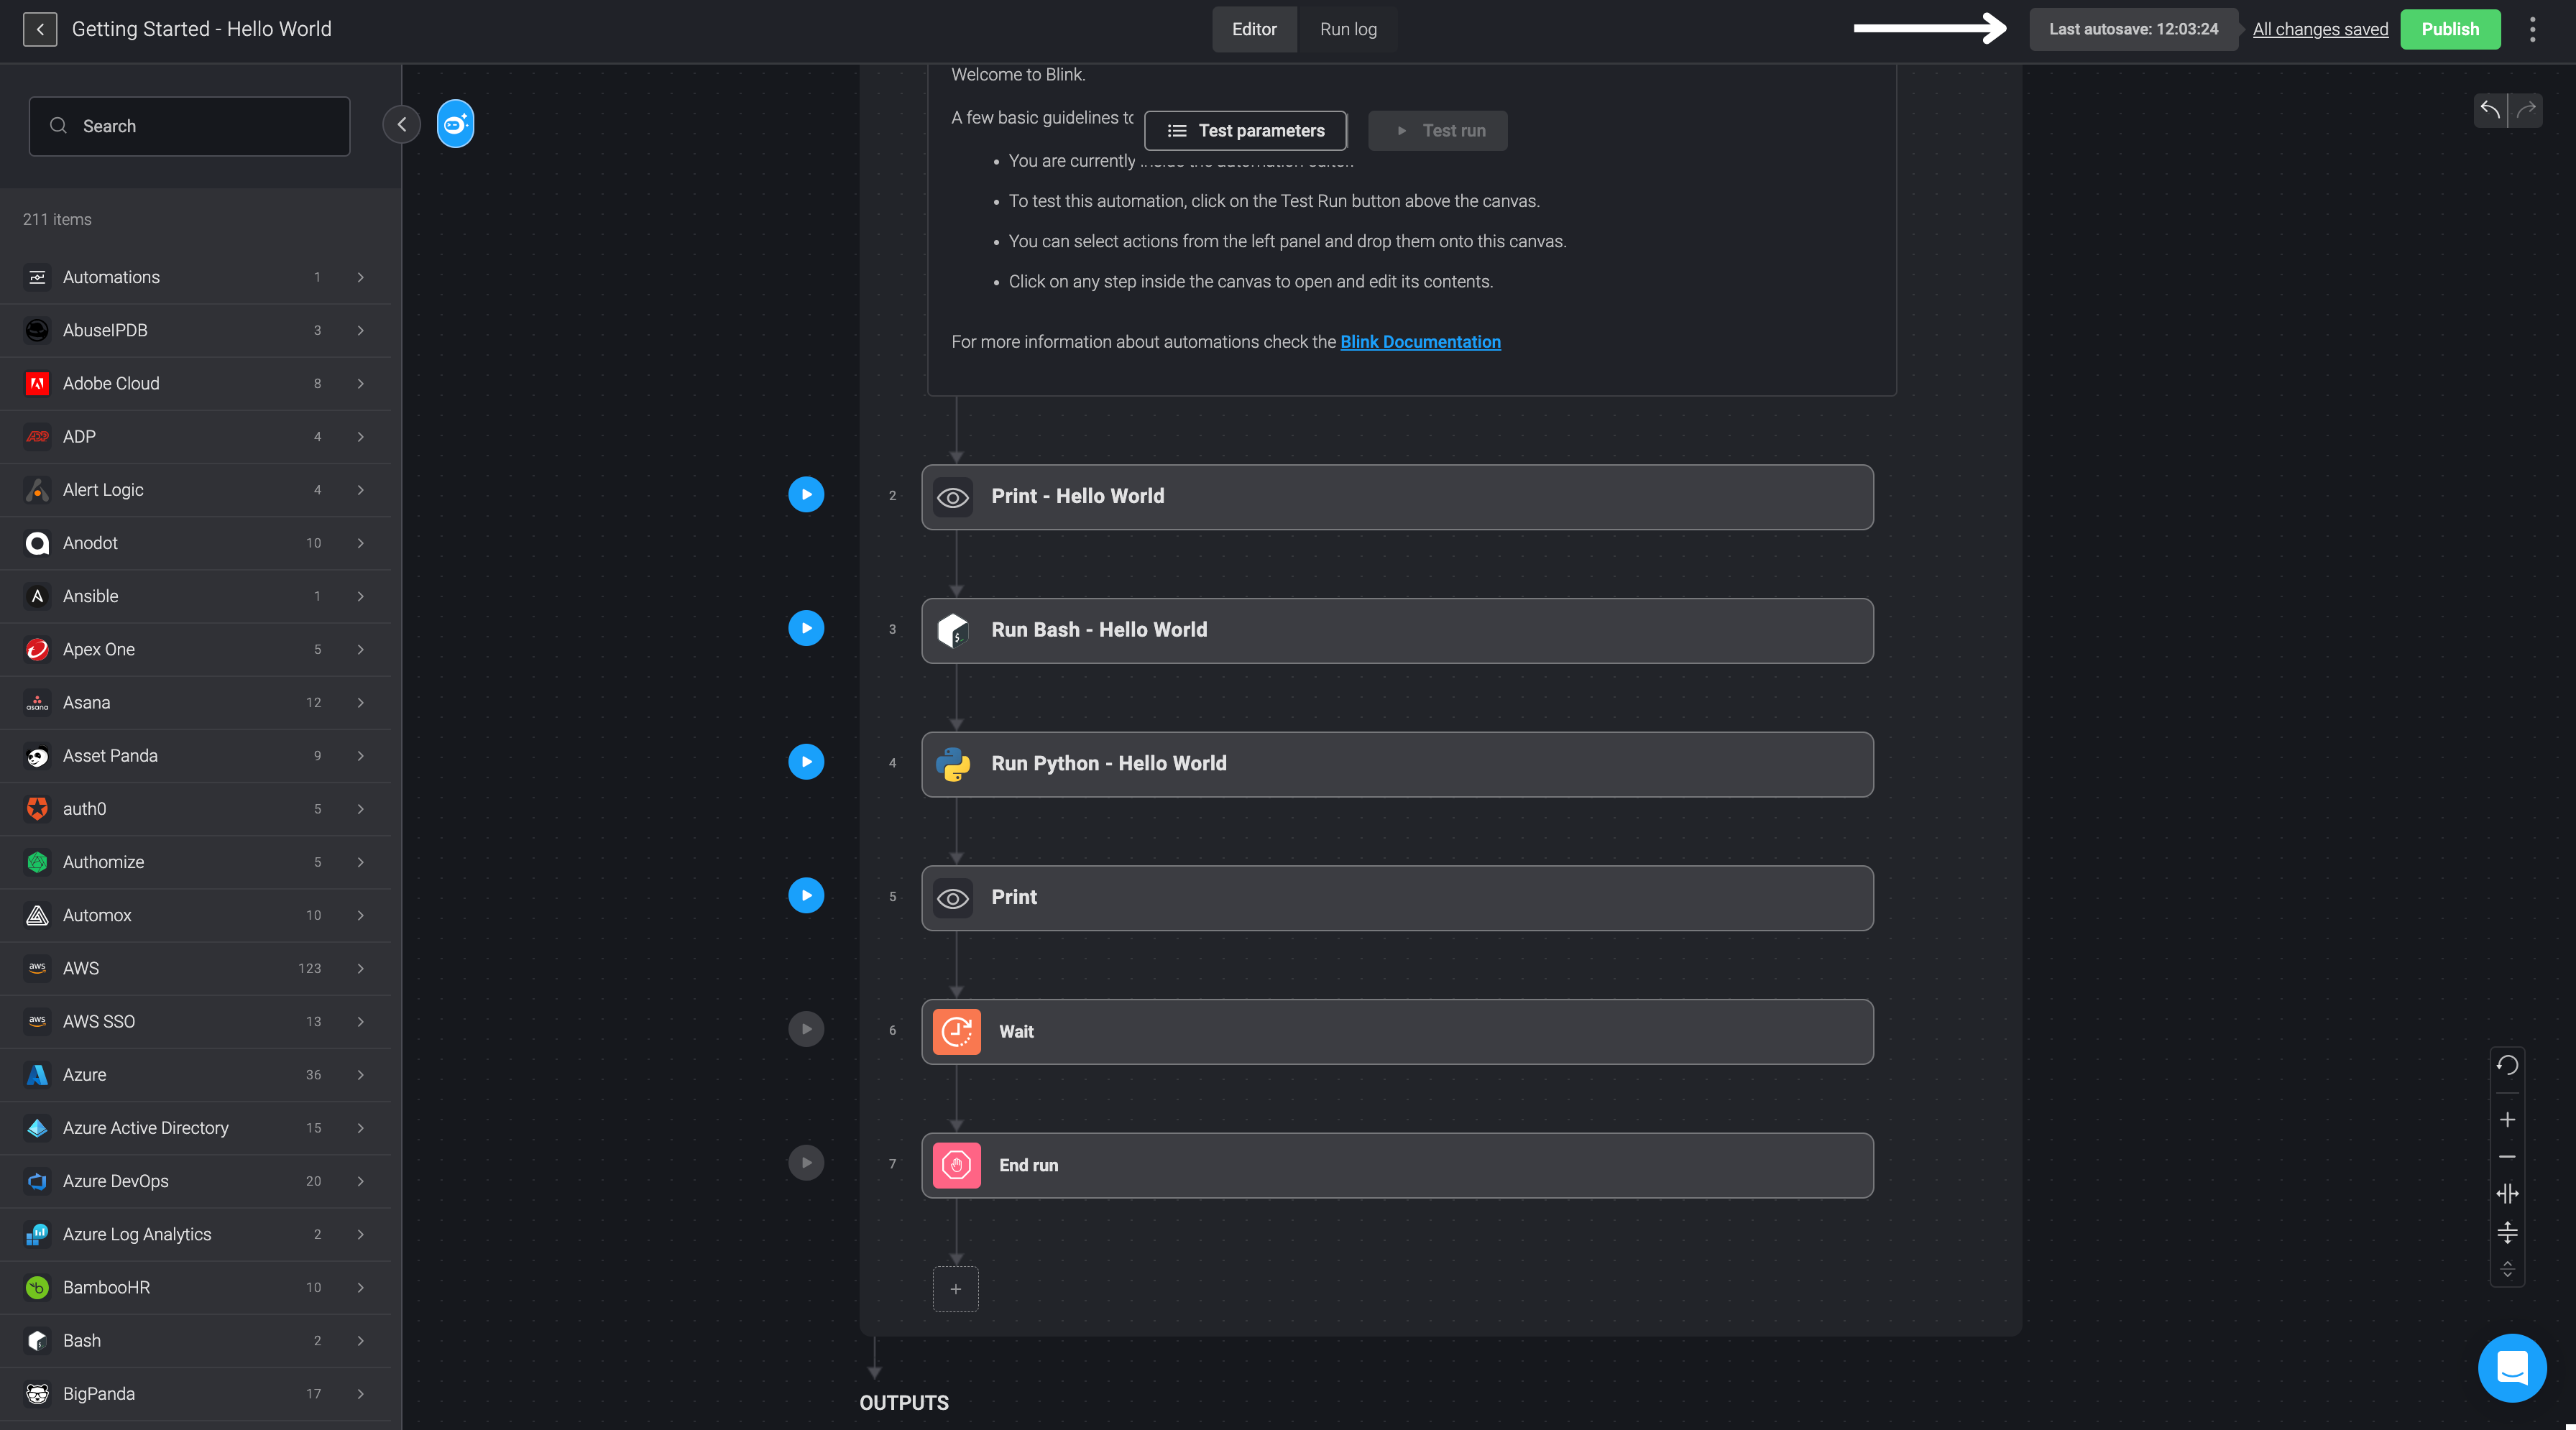
Automation Editor and Automation Run Logs
- Click anywhere on the automation within the automation pack.
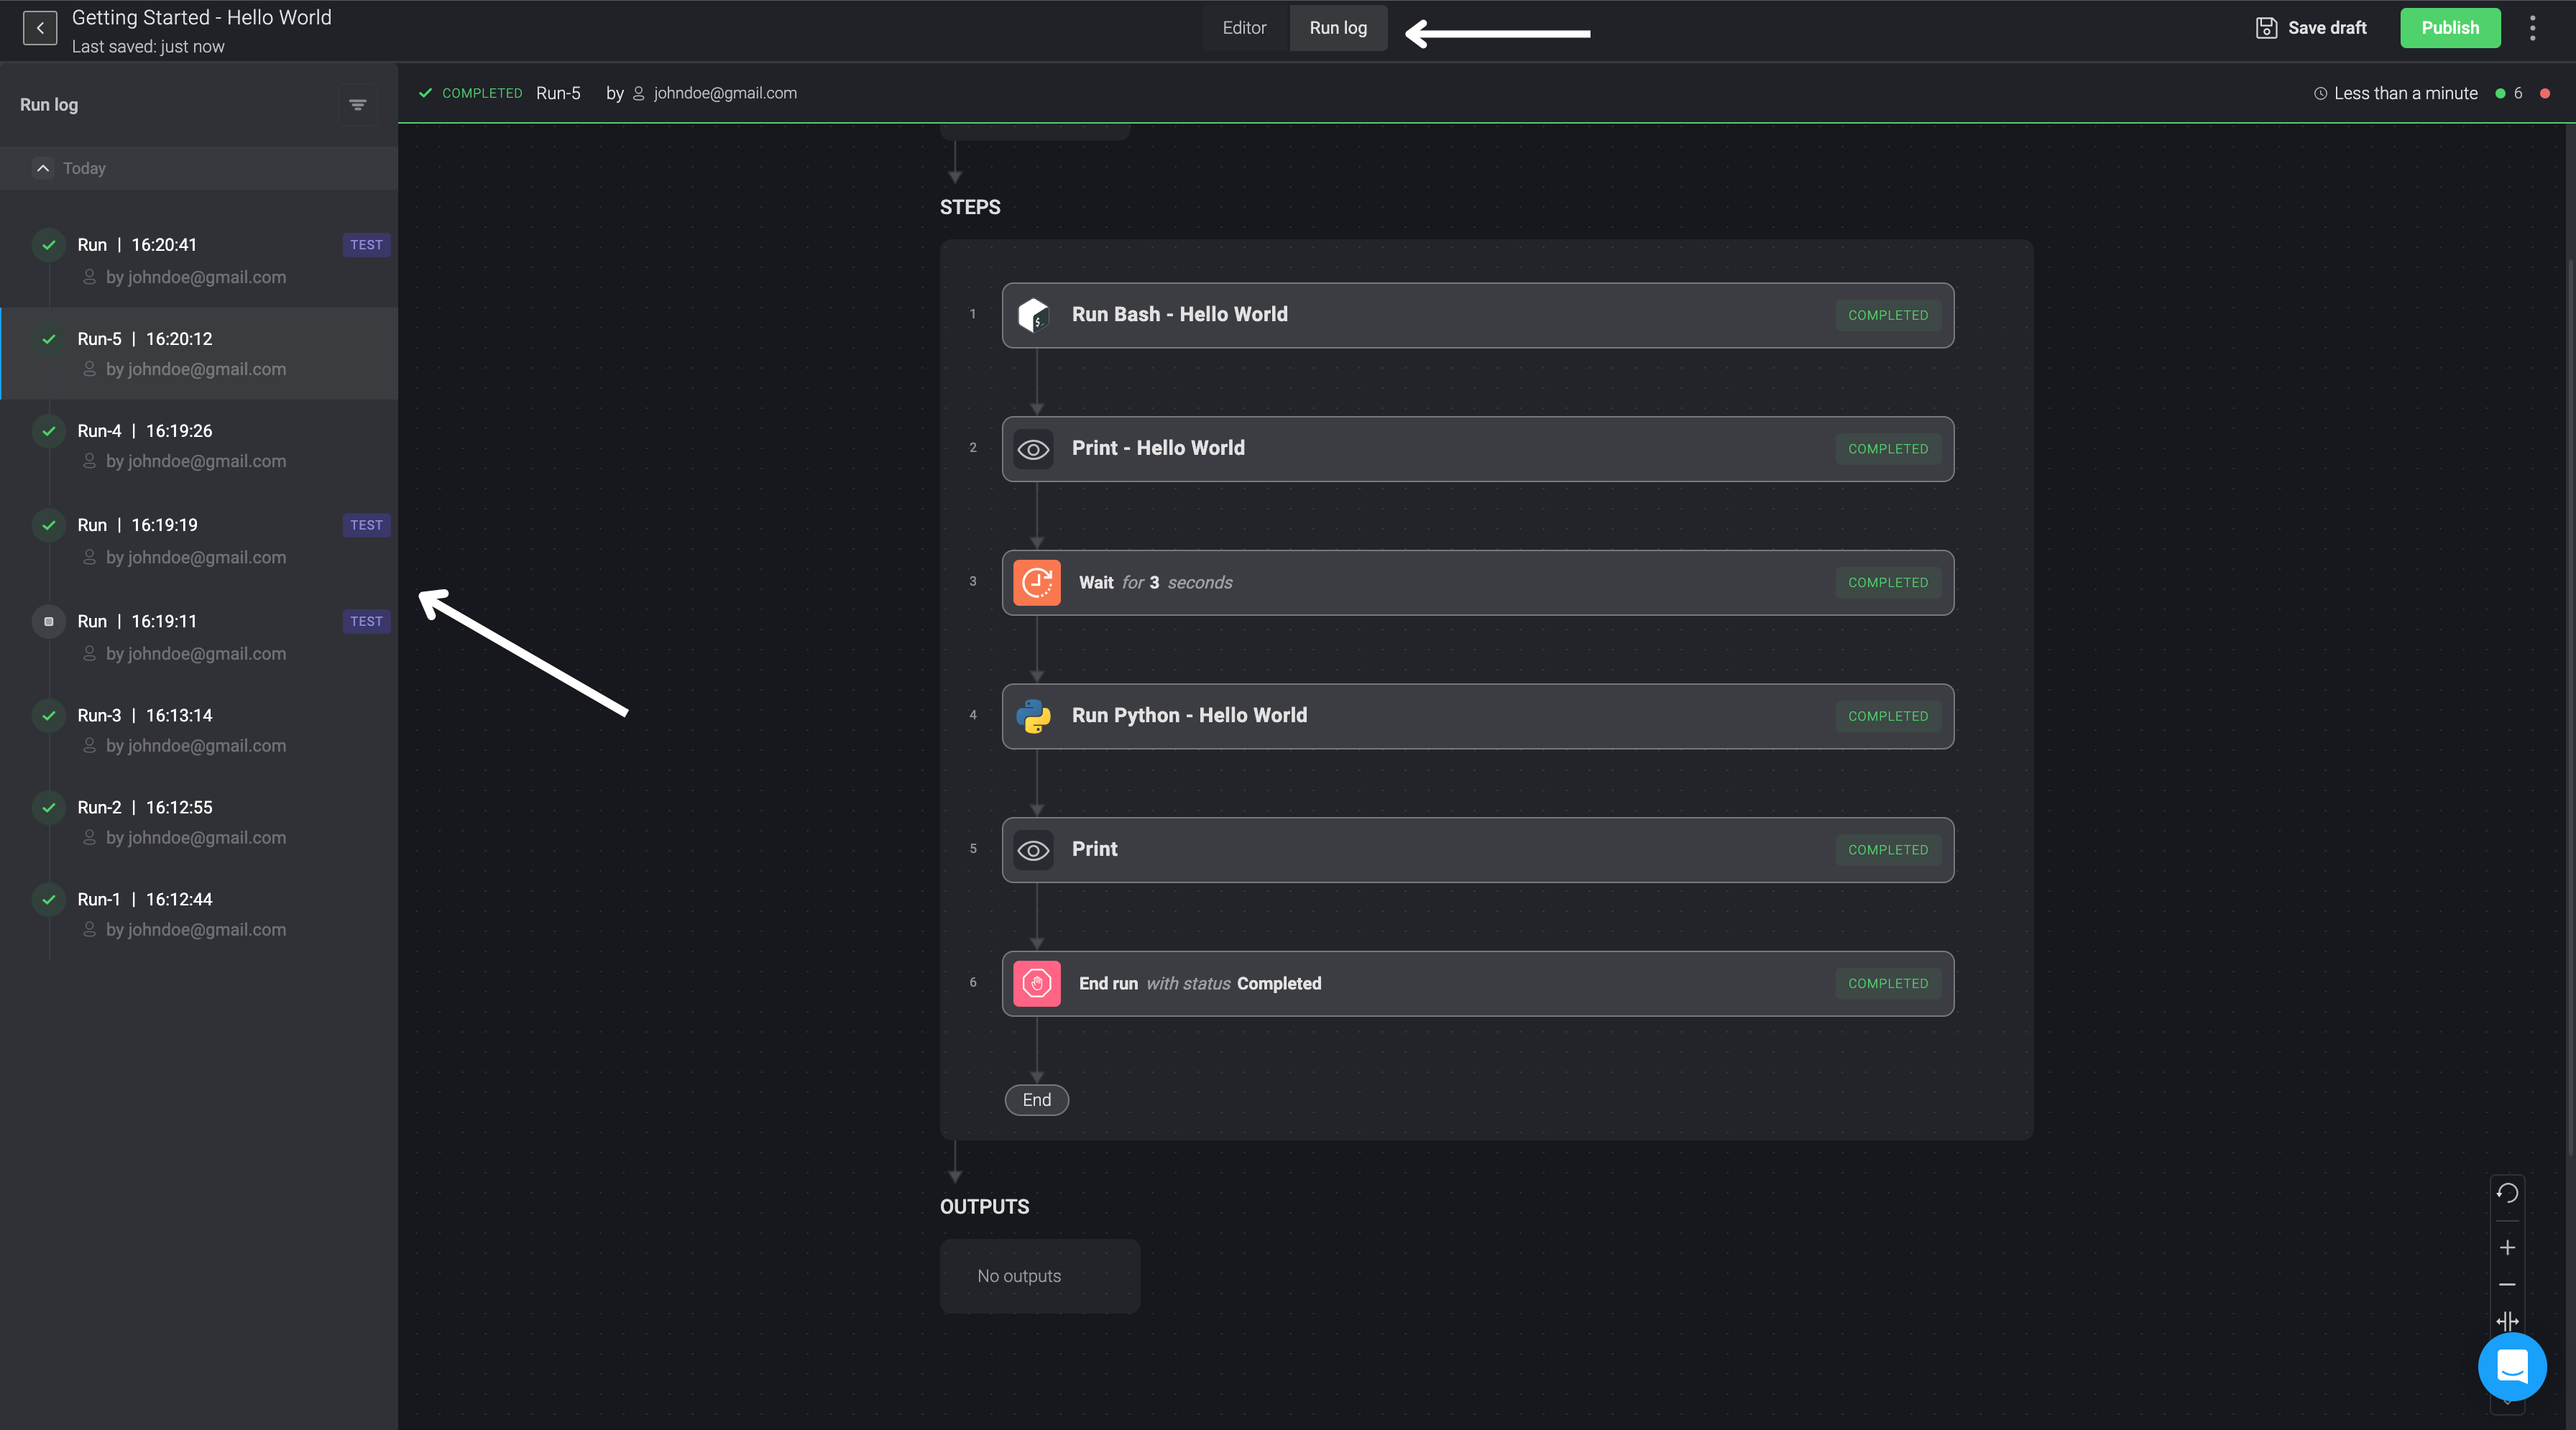
- You will be directed to the automation canvas, where you can find two tabs at the top of the screen. The Editor tab is the default tab for editing the selected automation and the Run Logs tab to access the automation's Run Logs.
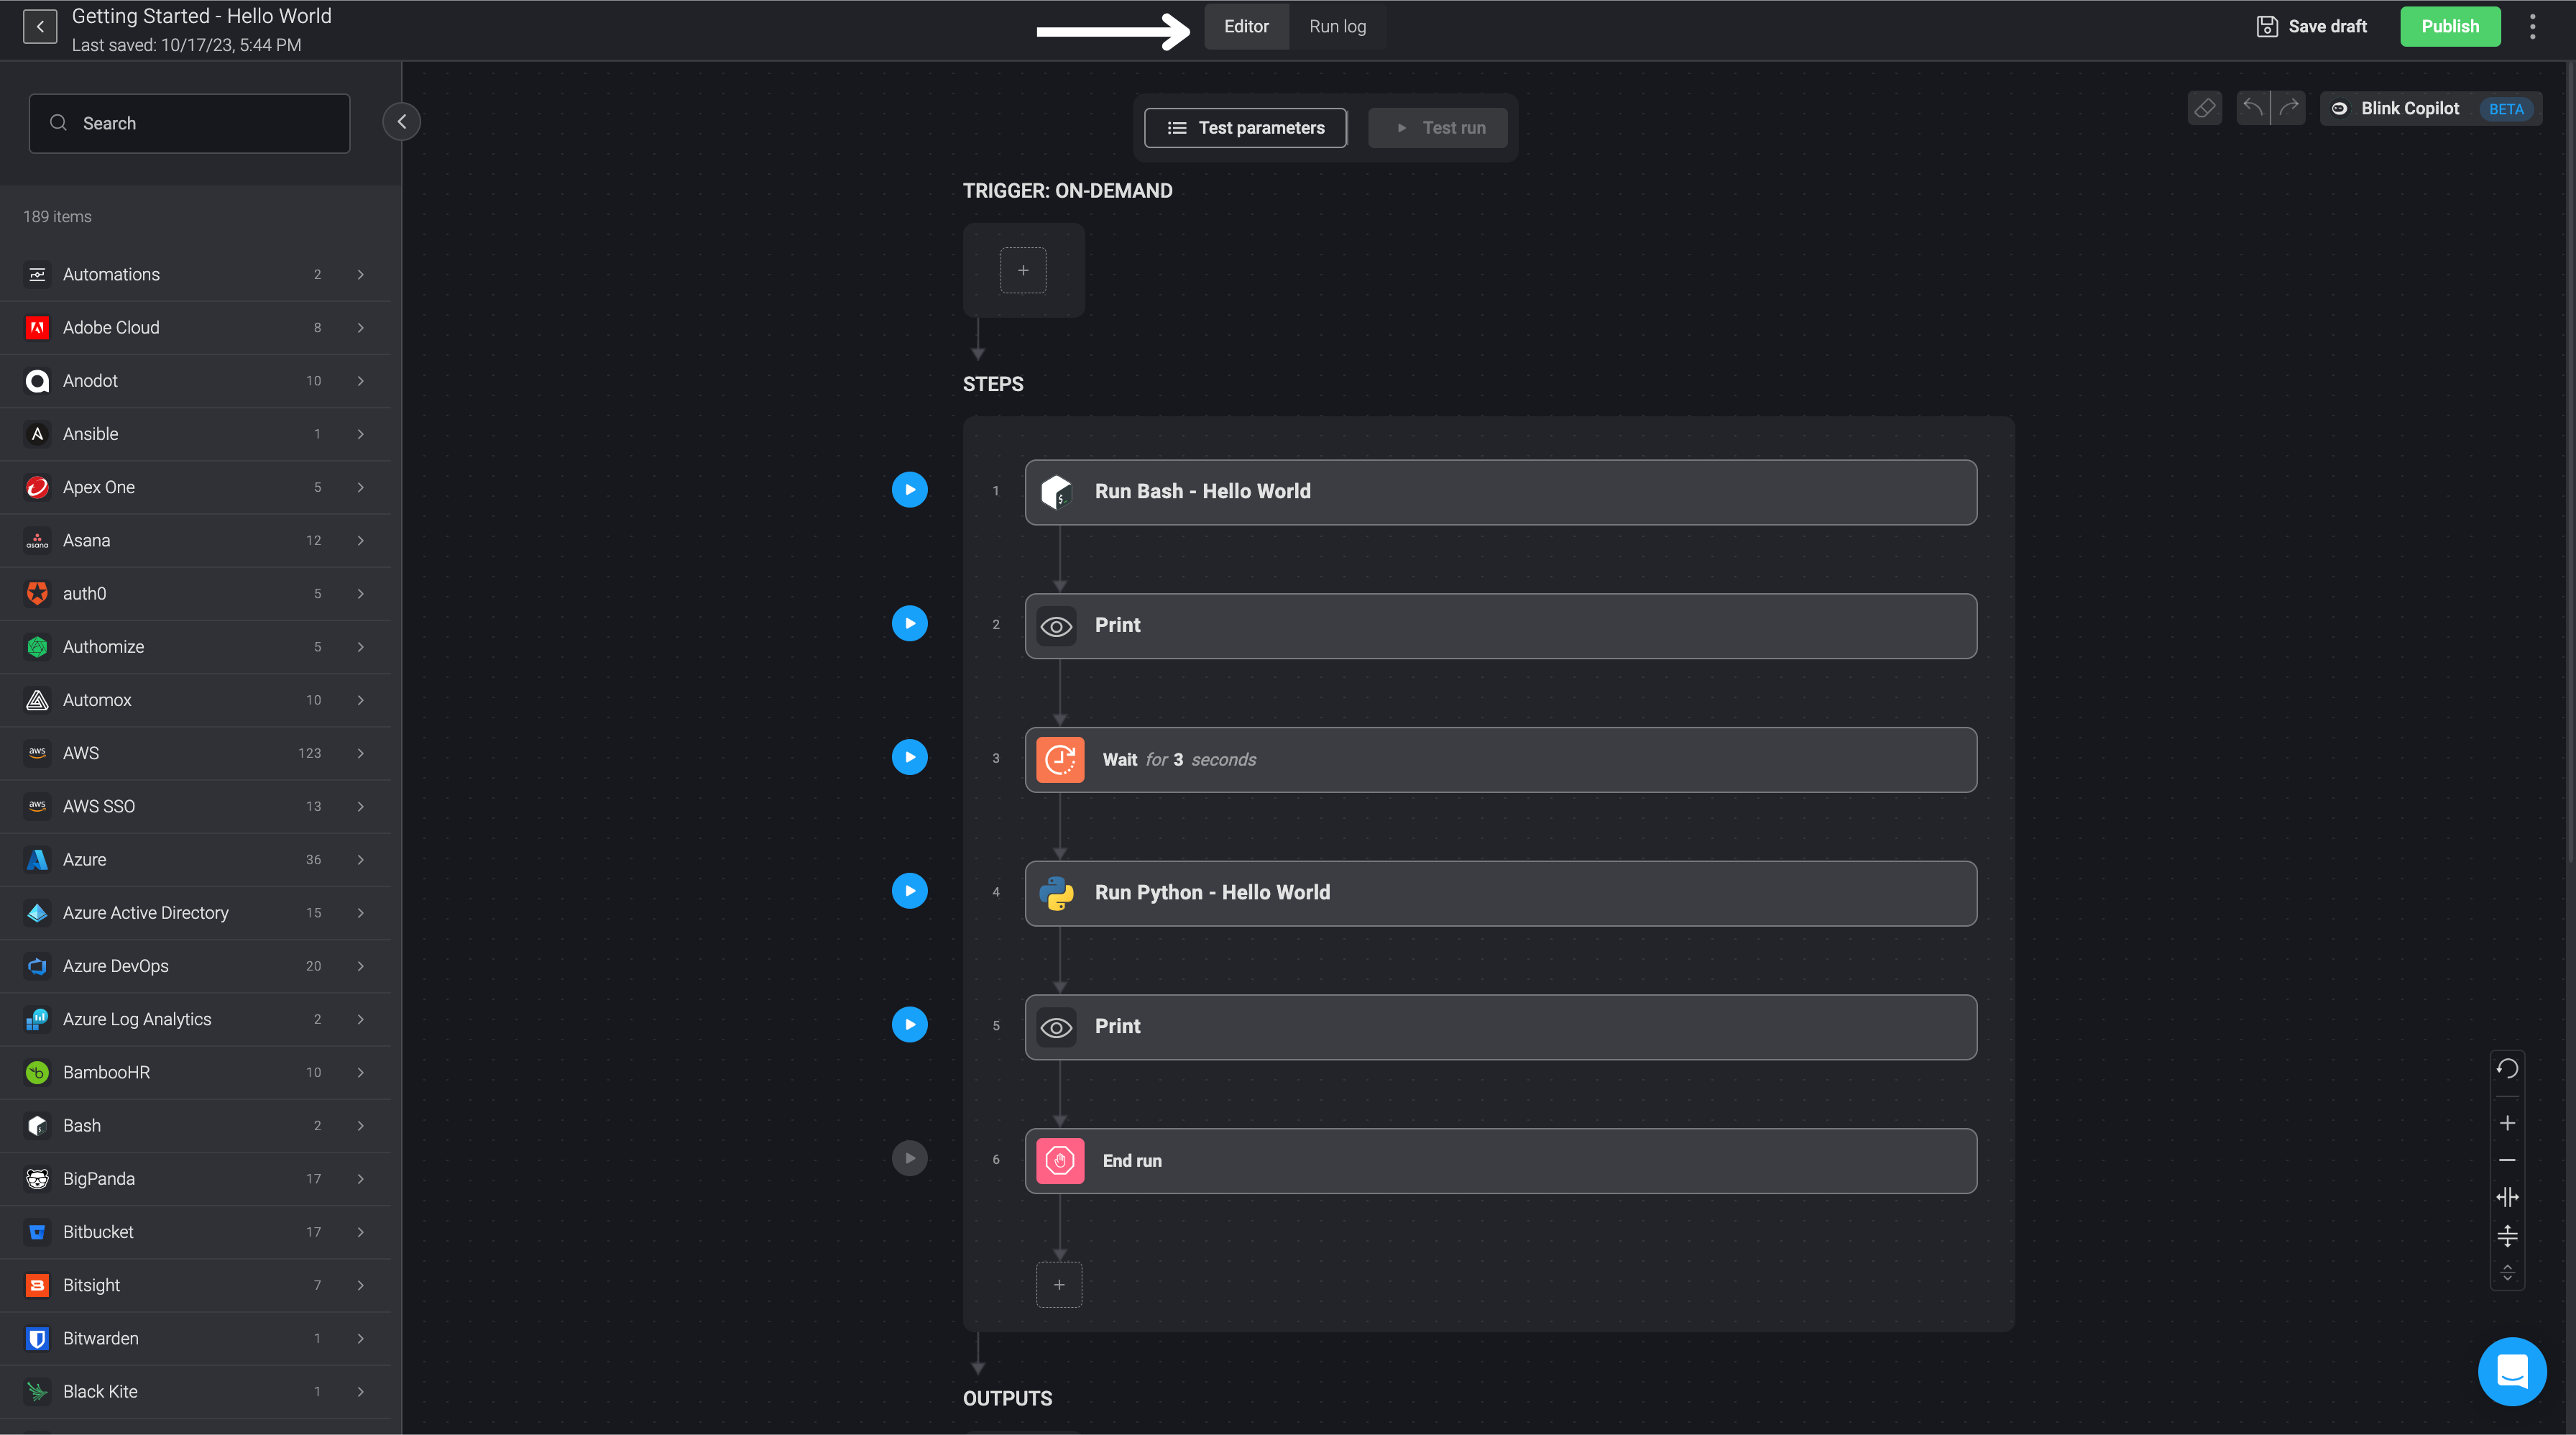
- To view the automation's Run Logs, select the Run Logs tab, and then choose the specific automation Run Log you wish to view. Next to each automation, it will indicate whether it is a Test Run Log or an Active Run Log as well as the time selected automation ran.
- In the top right corner, you can click on the three dots button
 , a dialogue box will open offering three options: Edit Yaml where you can make any changes to the YAML format, Settings to view and edit details of the selected automation, and Version History to access various version histories for the selected automation.
Autosave Automation Draft
When you make edits to your automation steps in the automation editor, the system will save your changes automatically. To check the timestamp of your latest modifications, simply hover over the All Changes Saved link located in the top-right corner. Clicking on this link will open the version history of your automation, allowing you to review or restore its previous versions.
If automation fails to save, such as during a lack of internet connection, the autosave indicator will display not saved. Hovering over the indicator will provide additional details, if relevant.
To avoid conflicts or potential loss of work, please be aware that concurrent editing is restricted. If a user is currently working in the editor, others will be unable to edit the same automation to ensure a seamless process.
Viewing Automation outputs
View past executions in the Execution History tab. The left-hand side of the screen lists a history of executions and their status. The status can be one of the following:
| Status | Icon | Description |
|---|---|---|
| Completed | The Automation has run successfully. | |
| Stopped | The Automation has been stopped by the creator. | |
| In progress | The Automation is running. | |
| Pending | A Step is pending human approval. | |
| Failed | The Automation failed to execute successfully. | |
| Timed out | A Step has timed out as no approval was granted. |
Click on any execution and the details of that specific execution are displayed. On the top of the page, a status bar shows relevant information pertaining to the execution. Beneath it you can see input parameters entered by the user, and details of each Step.
At the bottom of the page, click on an output parameter to see details about a specific output that was returned to the user.
Viewing the event payload of event-based Automation
See the payload that triggered a certain event.
Note This is relevant for Automations triggered by webhooks and pre-defined events.
Navigate to see past executions in the Execution History tab and select an execution.
View the event payload of an event-based Automation by clicking View Event next to the Trigger. An Event dialog box opens. You can copy the event to create another Automation.