Monitoring Automation Health
Monitor your Automation activity using tools in the Blink platform. All your past executions can be seen on the Executions page and each Automation shows its past executions in the Run Log tab. The activity graph of an Automation indicates if an Automation failed and why. You can opt to receive notifications on failure of Automations via email.
Monitoring Automation activity
Past executions
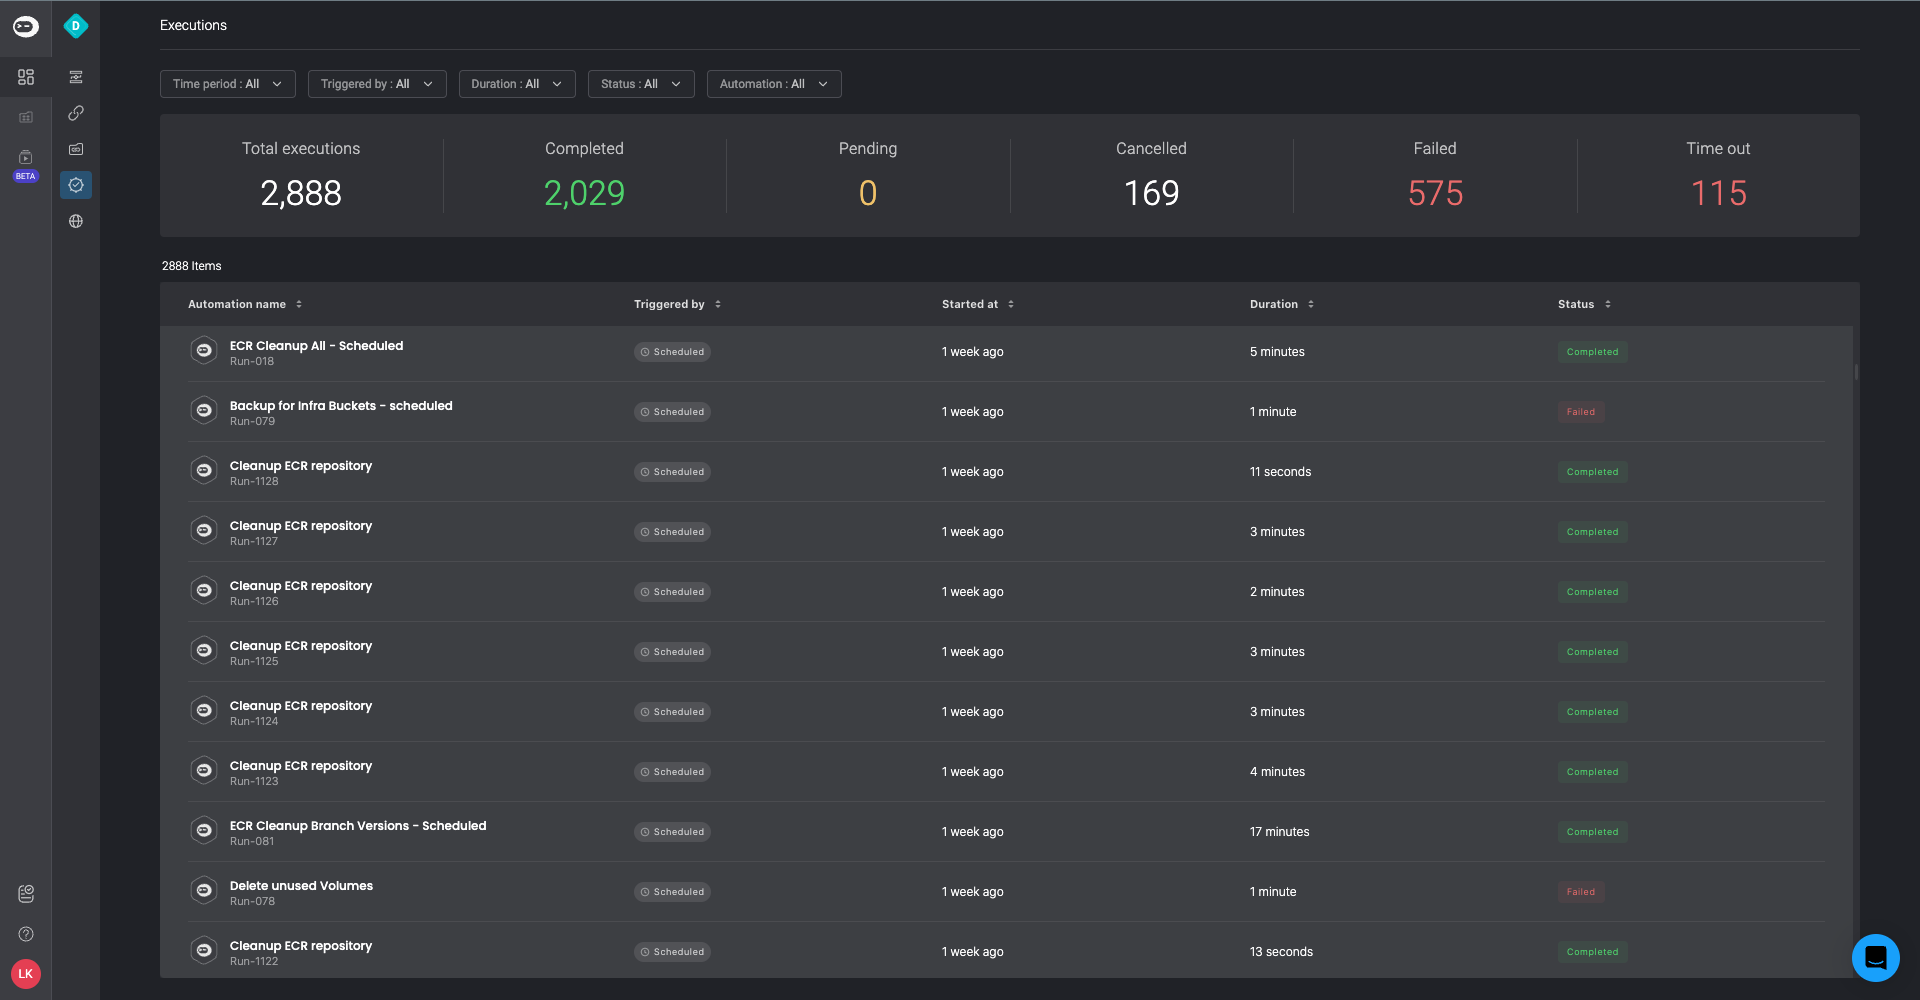
View all past executions of a workspace in the main navigation menu > Executions. The page lists a history of executions and their status. The status can be one of the following:
| Status | Icon | Description |
|---|---|---|
| Completed | The Automation has run successfully. | |
| Stopped | The Automation has been stopped by the creator. | |
| In progress | The Automation is running. | |
| Pending | A Step is pending human approval. | |
| Failed | The Automation failed to execute successfully. | |
| Timed out | A Step has timed out as no approval was granted. |
Run Log Execution History
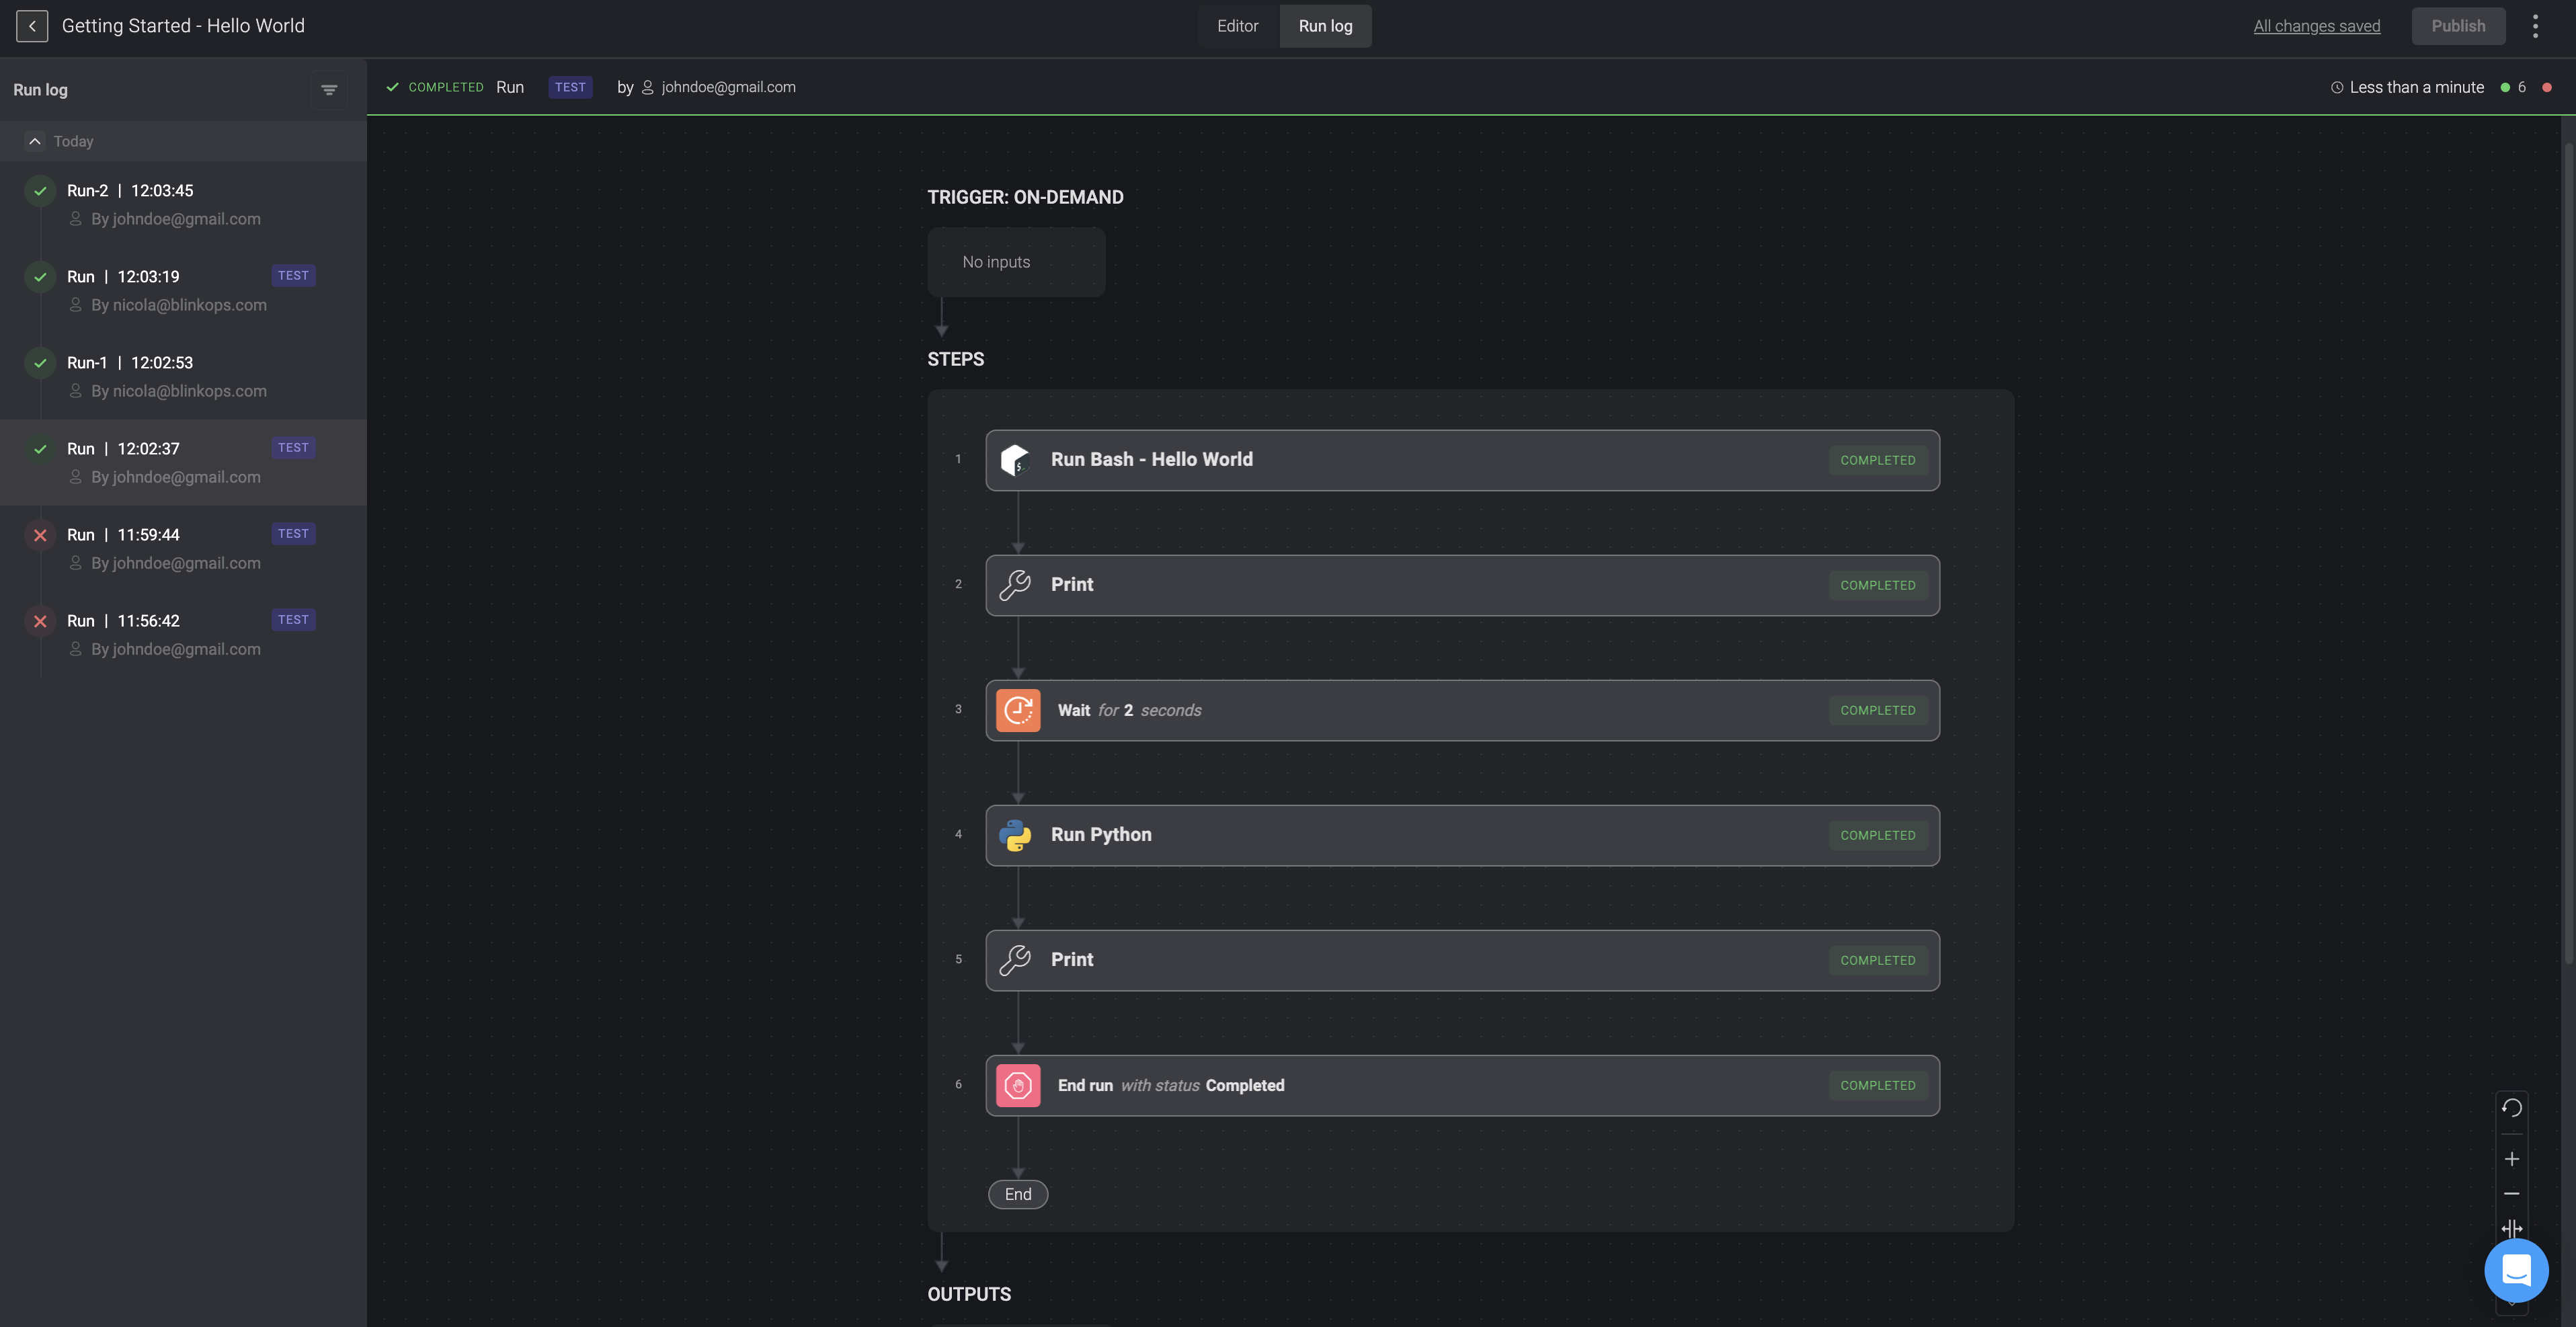
Click on any execution and you will be redirected to the Run Log tab of that specific Automation. The left-hand side shows a list of past executions. At the top of the page, a status bar shows relevant information pertaining to the selected execution. Beneath it you can see input parameters entered by the user, details of each step, as well as the output that was returned to the user. Click on an output parameter to see all outputs relating to this execution, or click on another execution of the same Automation to see its details. The run log displays executions from the last 30 days.
You also have the option to choose whether you want to display test runs in the Runs logs section. To do this, simply click the ![]() icon located in the top-right corner, and then check the box if you want to show test runs or uncheck it if you prefer not to display them.
icon located in the top-right corner, and then check the box if you want to show test runs or uncheck it if you prefer not to display them.
From the Automations page, see past executions of any Automation by selecting the Run Log tab.
Activity graph
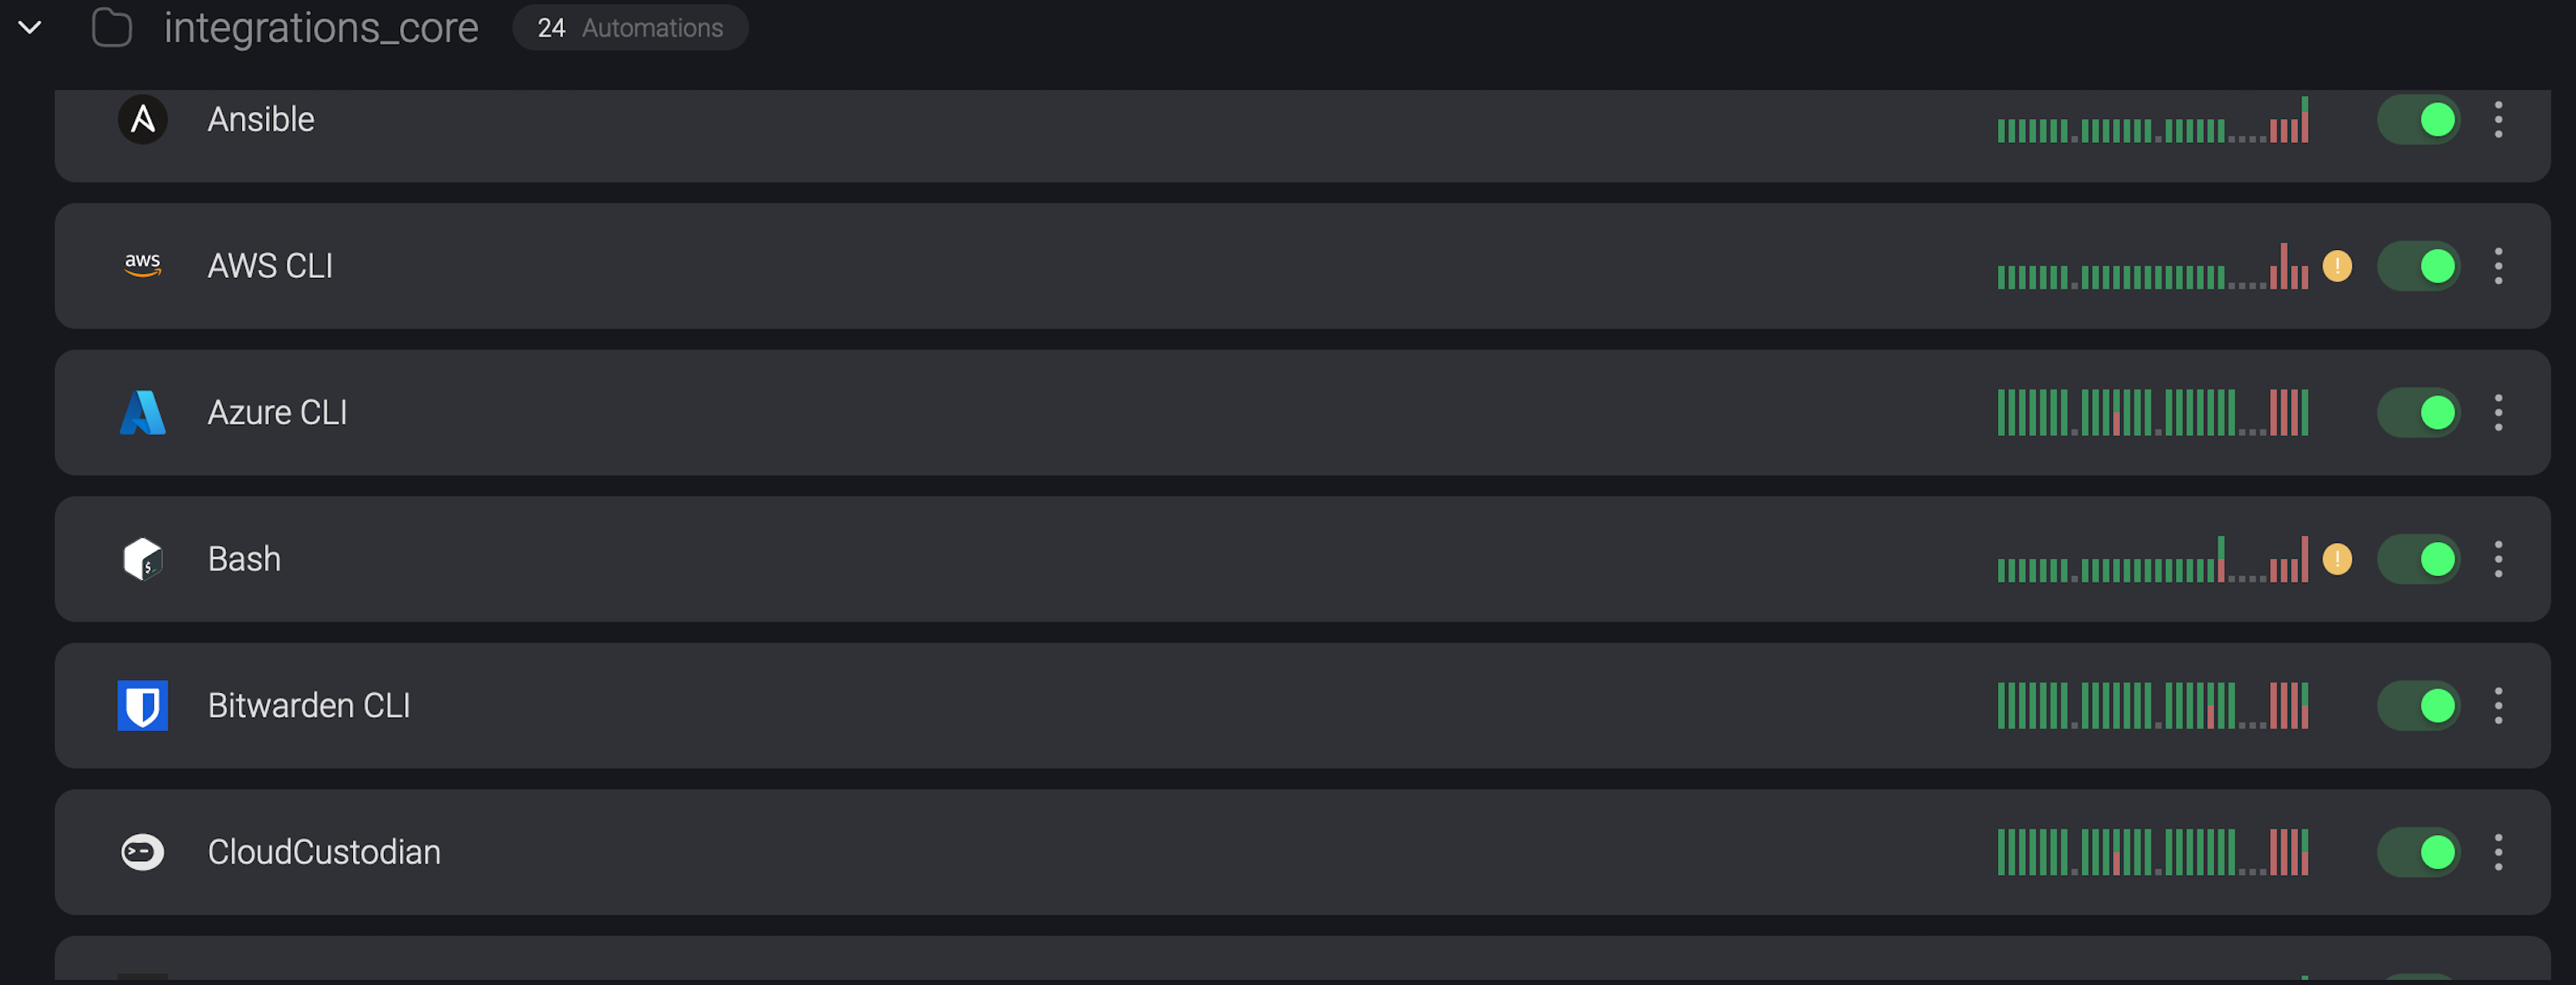
The activity graph can be found on the Automations page, next to each Automation, and shows the activity trend in the last 30 days. Click on the graph and you will be taken to the Automations execution page, automatically filtered to view the last 30 days.
Monitoring Automation failure
Error indicator on the activity graph
The activity graph can be found on your workspace Automations page. Upon failure on the last run, an error symbol - the small orange circle with the exclamation mark in the middle - will be displayed. Hover your cursor over the graph to see a tooltip that displays the time and reasons for the error.

Monitoring Automation failure via email
Select which Automations to be notified, via email upon failure. For example, get notified if system critical resources management or production-critical automations fail, so you can attend to such issues quickly. Select which users to notify for each Automation.
Configuring notification on error
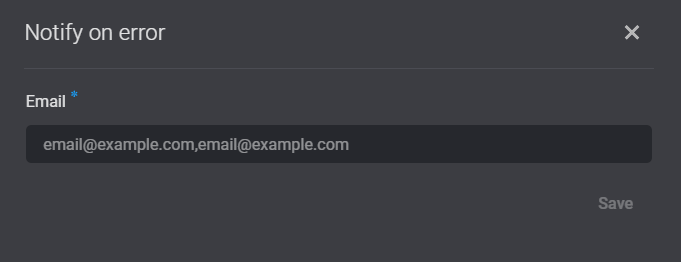
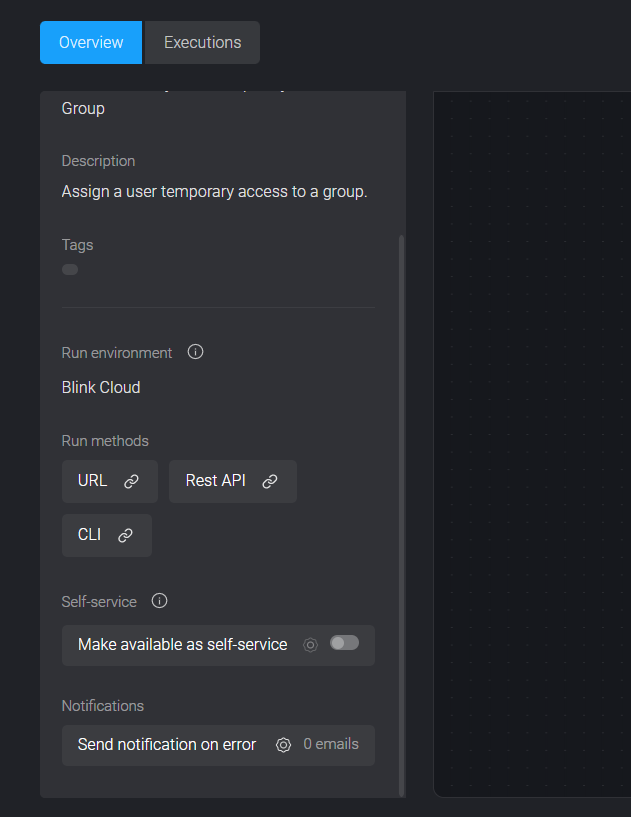
- In the Automation page, in the right-hand pane under Notifications, click
 Send notification on error. A dialog box opens.
- Enter the email addresses of users that will receive the notification upon failure of the Automation execution. Split the list of email addresses by a comma.